|
James S. Aber and |
In the 1970s and 1980s, Danish wind energy underwent revolutionary development beginning with the famous Tvind wind turbine. The 2.0 MW turbine was completed in 1978. It represents the core technology and decisive breakthrough for Danish wind turbines (Maegaard 2009). In that same year, the Danish Wind Turbine Owner’s Association was established, which encouraged sharing of technology by inventors and self-builders using diverse materials, varied construction techniques, and numerous turbine and blade designs. Within a few years, Vestas, Bonus, Nordtank, Micon, and other Danish companies became world leaders in the manufacture and export of robust and reliable wind turbines.
Since then, Danish wind turbines have emerged as the industry standard, and wind power based on the Danish model has spread around the world, particularly in North America, Europe, and Asia—see Danish and Polish wind energy. Wind energy was a niche enterprise in the late 20th century, but it has grown rapidly in the early 21st century. Total installed wind-power capacity
worldwide by the end of 2023 had reached 1021 gigawatts (GW) led by China (441.1 GW) and the United States (150.5 GW), which together accounted for more than half of global wind-generating capacity.
The Great Plains region has the most installed wind-generating capacity in the United States, as this table demonstrates. Texas has by far the largest capacity, followed by Oklahoma and Iowa. Kansas currently ranks fourth among states for installed wind-power capacity. As of mid-2024, Kansas had more than 4200 wind turbines with a total wind-generating capacity of 9.1 GW (Aber and Aber 2024). See Kansas wind farms for details.
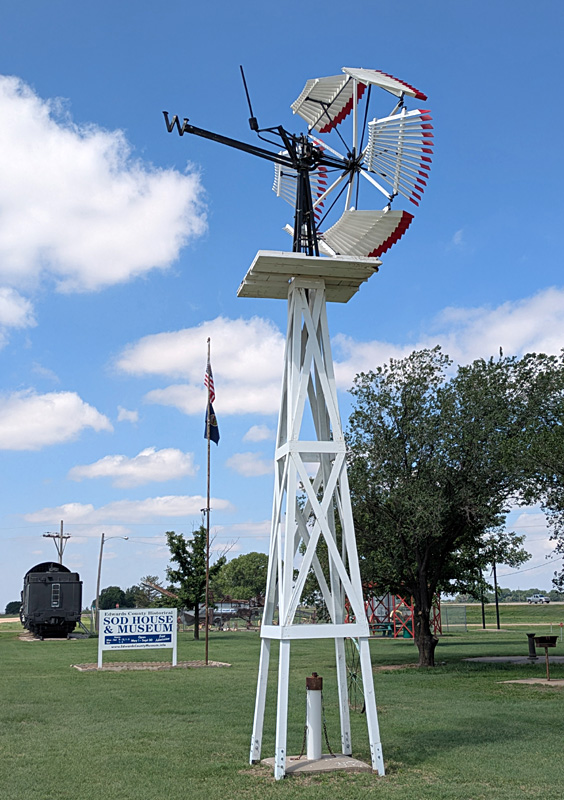
Right – Baker Monitor W Series, back-geared, self-oiling windmill restored at Lakin, Kansas. The wheel has 15 fixed, curved steel blades. The distinctive vertical tail vane was introduced around 1940 and continued to be made into the 1960s (Baker 1985).
The W counterbalance arm points into the wind, and the blades are folded in the downwind position. This windmill suffered storm damage, so it had to be taken down and repaired. Installation of repaired mill took place in the spring of 2026, as shown here.
Right – modern Aermotor turbine mounted on an older tower. Typical of windmills with a tail vane to control wheel position. Marion County in the Flint Hills (2022).
The first large wind farm in Kansas came to Gray County in 2001, and wind energy expanded quickly across the state during the next two decades. As of 2024, Kansas had about 8.6 gigawatts (GW) of installed wind-power capacity, more than 6% of total US capacity. More than 40% of total electric-generating capacity in Kansas is from wind energy, which is greater than combined coal plus natural gas capacity.
Wind energy generated some $48 million in direct annual payments to Kansas landowners and $660 million in lifetime payments for local governments to support rural counties (Miller 2022). The Nature Conservancy has analyzed the wind-energy potential for Kansas along with impacts on wildlife and habitat. More than one-third of the state is suitable for wind energy based on engineering and land-use constraints, and nearly one-fifth of the state was identified as low impact for wildlife and habitat (TNC 2022).
As we followed the development of wind energy, we realized that kite aerial photography (KAP) is a special technique to acquire low-height imagery beside and even within active wind farms, where other methods of aerial photography would be risky or prohibited. We have pursued KAP in many Kansas wind farms and elsewhere across the United States, Canada and northern Europe. KAP has proven to be an effective way to illustrate wind turbines and their surroundings.
Nearly all wind farms in Kansas, in fact, are situated on drainage divides. The first Kansas wind farm in Gray County, for instance, is located on the divide between the Arkansas River and Crooked Creek. The master drainage divide for Kansas trends across the state from west to east and separates the Missouri River basin to the north from the Arkansas River basin to the south. Wind farms are sited along this major divide from the High Plains in the far west to the Osage Cuestas in the southeast.
Post-Miocene rivers then began to entrench their valleys, and this trend accelerated with ice-sheet glaciation about 650,000 years ago. The Ogallala Formation was removed partially by erosion, and the underlying bedrock was revealed and underwent further erosion. The current pattern of drainage divides, thus, reflects this wholesale wearing down of the landscape. Overall, the distribution of wind farms across Kansas exploits these patterns of erosion and the resulting drainage divides.
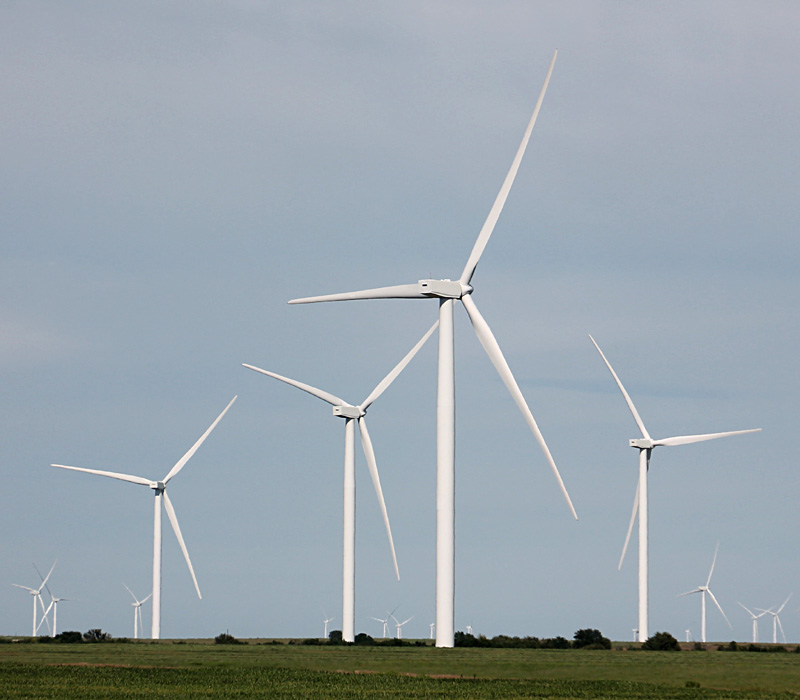
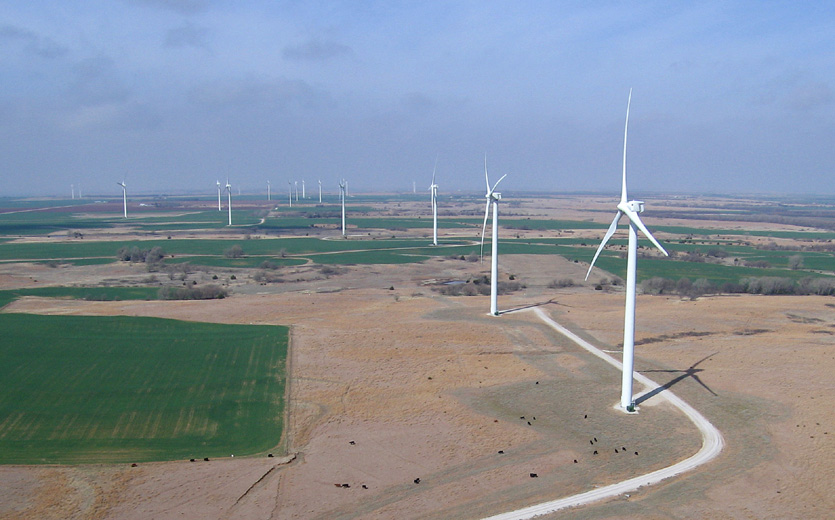
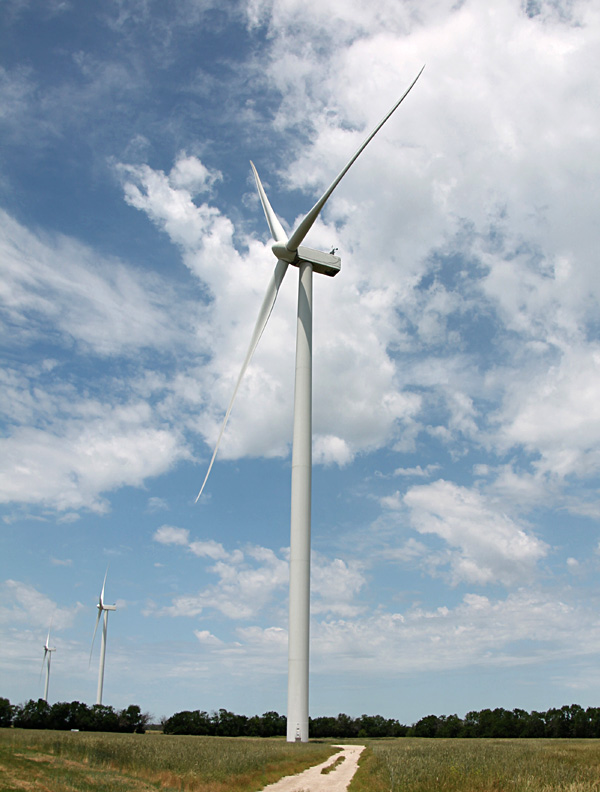
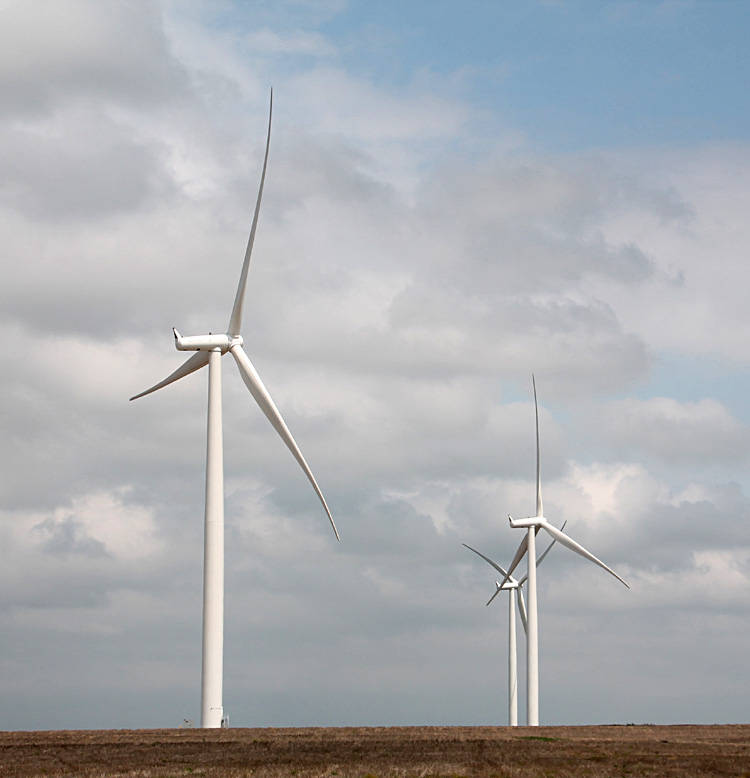
Gray County Wind Farm (2001) – The first large array of wind turbines was erected on the High Plains of southwestern Kansas. Located near the city of Montezuma, southwest of Dodge City, the wind farm contains 170 Vestas V47 turbines that could generate up to 112 megawatts of power, enough for ~35,000 households. The Danish turbines stand 65 m (213 feet) tall at hub height and 90 m (295 feet) high to the tip of the upright blades. These are, in fact, relatively small turbines compared with later wind turbines (see below).
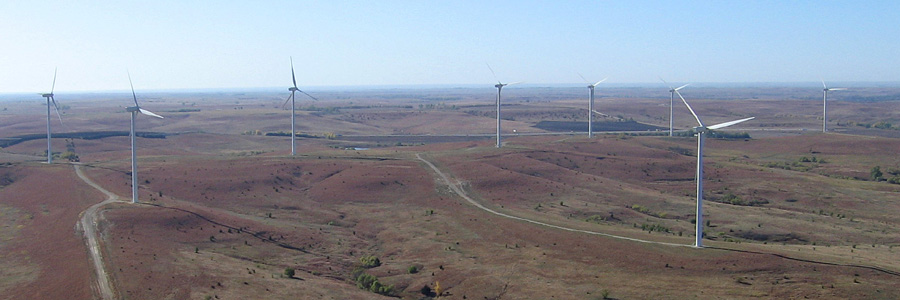
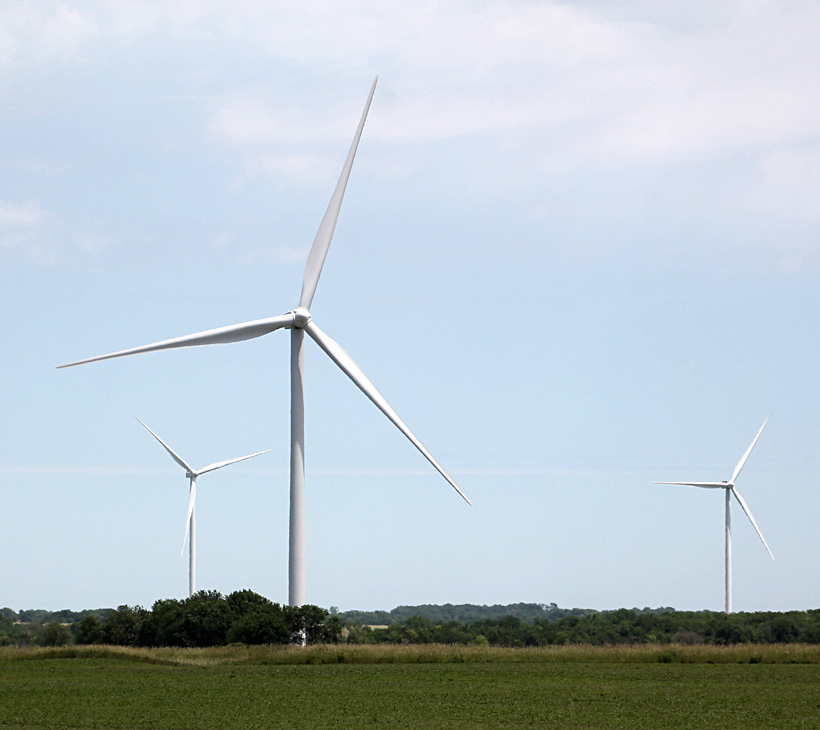
Elk River Wind Farm (2005) – One hundred wind turbines are situated on the crest of the Flint Hills, which forms the drainage divide between the Fall-Verdigris and Walnut-Arkansas basins. This site is ideally located to catch wind from all directions. The GE Wind turbines are capable of generating 150 megawatts of electricity, sufficient for about 42,000 homes. Each tower is 262 feet tall and blades are 125 feet long. Total height with a blade in the upright position is about 390 feet.
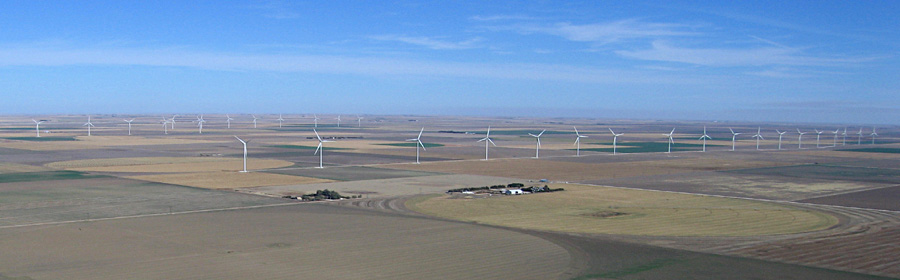
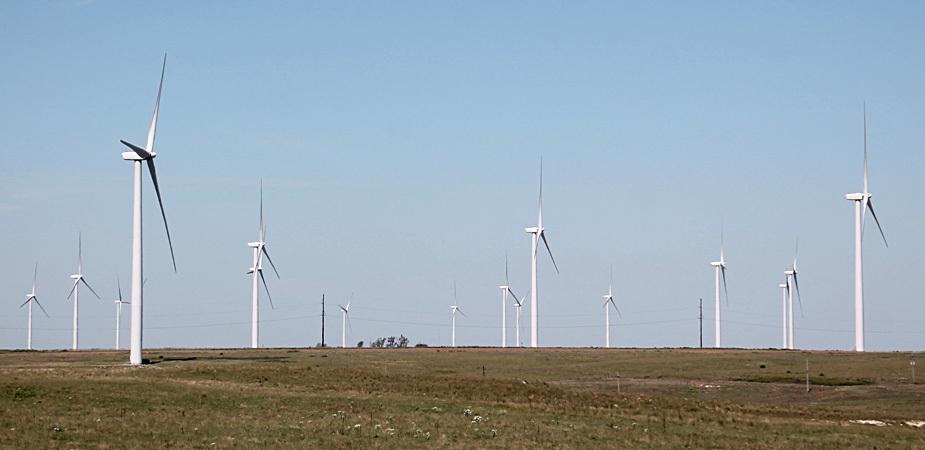
Spearville (2006) – Spearville has long been known as the Home of Windmills, an appellation that dates from the days of small windmills used to pump groundwater for irrigation and livestock. This tradition now has a new dimension with wind generation of electricity. The original wind farm grew into a sizable wind-energy complex along US 50 highway northeast of Dodge City. This region is considered to be the most windy in the contiguous (48) United States, which explains the high interest in developing additional wind power in the vicinity.
Meridian Way Wind Farm (2008) – Located on the Blue Hills escarpment which stands about 175 feet above lower terrain to the south. This position is also on the drainage divide between the Solomon River and Republican River basins. Vestas V90 3 MW turbines are deployed in two arrays to the west and east along the drainage divide. Total height of the turbines is about 410 feet.
Flat Ridge Wind Farm (2009) – Originally 40 Clipper C96 turbines with 2.5 MW capacity, some of which were replaced later with Vestas V110 turbines with 2.0 MW capacity. The array extends approximately east-west in multiple lines on a narrow, mesa-like finger of the High Plains that forms the drainage divide between the Medicine Lodge River and Chikaskia River basins. Many turbines are situated in cattle pastures to minimize disturbance of the crop fields.
Since 2019, Kansas now has at least six wind farms in which turbine heights exceed 500 feet, namely Iron Star near Dodge City, Highbanks near Belleville, Reading Wind Facility near Emporia, Prairie Queen near Iola, Neosho Ridge near Erie, and Jayhawk (see above). The tallest of these reach nearly 600 feet in total height (USWTD 2024).
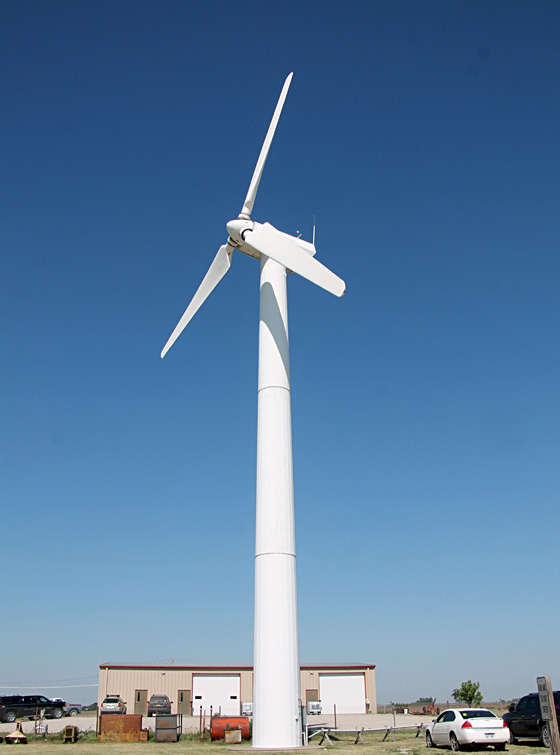
Right: Northern Power Systems (NPS) turbine at a business in Rush Center. NPS originated in 1974 and is based in Vermont.
Right: combined setup for wind and solar power provides electricity for Kansas State University Salina campus. The Excel turbine is a product of Bergey Windpower in Norman, Oklahoma.
Identification of wind turbines based on Winds of Change by Erik Grove-Nielsen and from wind-turbine-models.
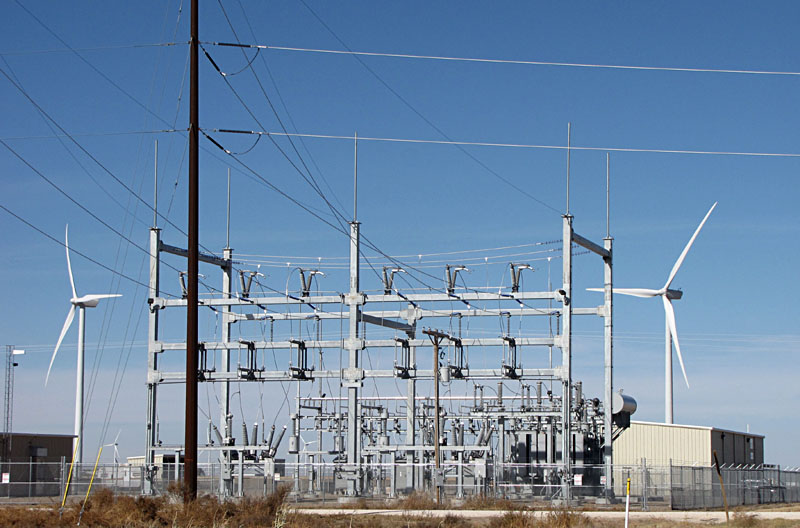
All wind farms connect to the electric grid via high-voltage transmission lines, and most have dedicated electrical substations, which have required much new construction to serve individual wind farms as well as wind-energy complexes.
Note: the supergrid infrastructure plan shown above was killed by the first Trump administration in order to help the coal industry. The Trump effort was largely unsuccessful, as shown by the drastic decline of coal-fired power plants (see below). However, the lack of an integrated nationwide supergrid has continuing consequences. Wind-generated electricity from western Kansas, for example, cannot be shared easily with the large urban/industrial area along the Front Range of the Rocky Mountains in Colorado, and Texas suffered an energy calamity in February 2021 because of its isolation (see Texas).
President Biden's Bipartisan Infrastructure Law was passed and signed in 2021 and has led to a dramatic change in how the U.S. approaches energy challenges of the 21st century. In 2022, for instance, the Department of Energy (DOE) released $28 million for wind-energy projects (DOE Wind 2022):
The DOE Office of Electricity is promoting grid modernization and the smart grid under authority of the Energy Independence and Security Act of 2007. Americans for a Clean Energy Grid have identified 22 transmission projects designed to access wind and solar energy and to interconnect about 60 GW of renewable capacity. These are shovel-ready projects that could be built within the next few years.
Of particular interest to Kansas is the Grain Belt Express that would connect southwestern Kansas to Missouri, Illinois and Indiana. The U.S. Department of Energy hosted "scoping meetings" across Kansas in early 2023 for public comment on phase I of the proposed high-voltage, direct-current (DC) transmission line (Hogg 2022). This first phase would extend 530 miles from the Spearville wind-energy complex in Ford County to Monroe County in northeastern Missouri. Construction is projected to begin by the end of 2024.
Visibility – Kansas had approximately 4200 wind turbines, as of mid-2024, and most of these turbines are taller than the Statue of Liberty at 305 feet (93 m). Thus, wind turbines are highly visible in many locales. Wind-energy complexes situated along US highway 50 east of Dodge City and either side of I-70 west of Salina are particularly obvious to the public.
The Reading Wind Facility, for instance, is plainly visible just a couple miles north of I-35 east of Emporia. From the Flint Hills west and southwest of Emporia, these same turbines may be seen on the horizon from at least 15 miles away. As a final example, US highway 59 north of Moran passes directly through the Prairie Queen wind farm, which has some of the tallest turbines in the state.
At night, wind farms have blinking red lights on selected turbines to warn approaching aircraft, which is another visibility issue. The lights throughout a wind farm are supposed to blink in unison according to Federal Aviation Administration (FAA) regulations. However, meteorological towers, which are a typical component of most wind farms, may blink on a different tempo. Likewise, adjacent wind farms, radio towers, or cell-phone towers may blink out-of-sequence from each other. The net result is off-cadence blinking that creates an annoying visual distraction for night driving and for nearby rural residences.
A bill moved through the Kansas Legislature last year; it requires wind farms to have blinking red lights that activate only when radar detects an approaching airplane (Llopis-Jepsen 2023). The technique, known as aircraft-detection lighting system (ADLS), turns red lights on when an airplane flies within 3 nautical miles and within 1000 feet above the highest point of a wind farm.
Two new wind farms, Highbanks north of Concordia and Sunflower near Florence, would be the first two wind farms equiped with ADLS. Most existing and new wind farms in Kansas may have such systems in the future, where allowed by the FAA. Colorado and North Dakota have both adopted similar requirements for wind farms, but Kansas would be the largest wind-energy state to do this so far. The Senate and House passed the bill, both almost unanimously, and Governor Kelly signed it into law in April 2023—see SB 49.
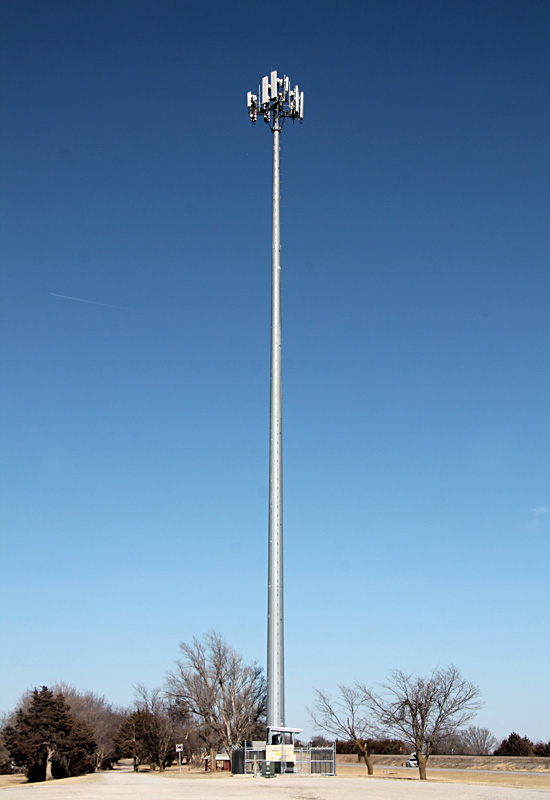
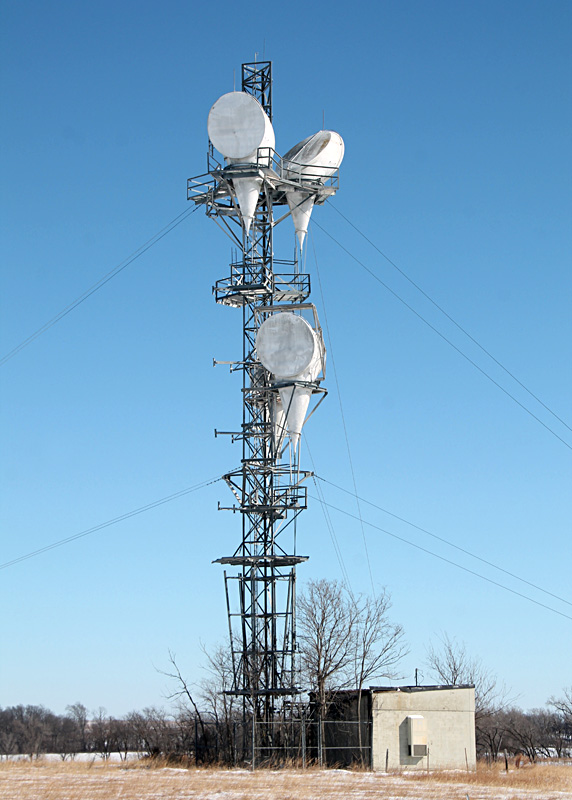
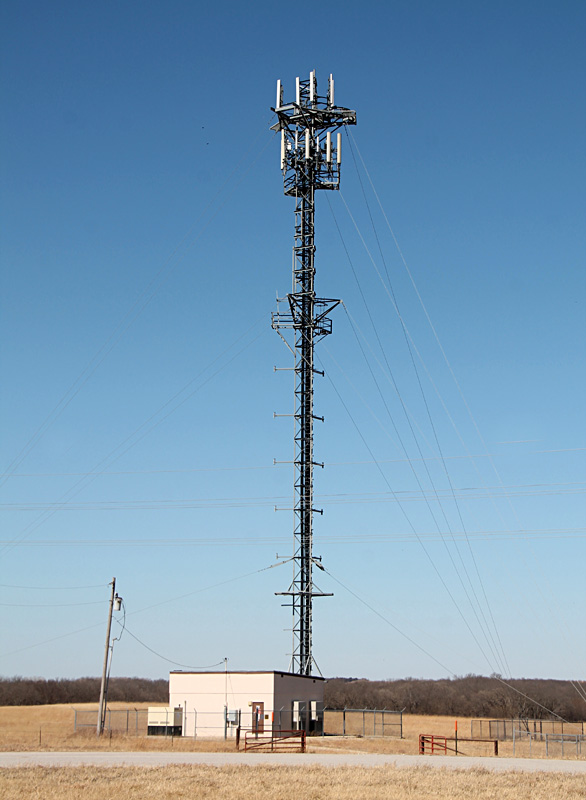
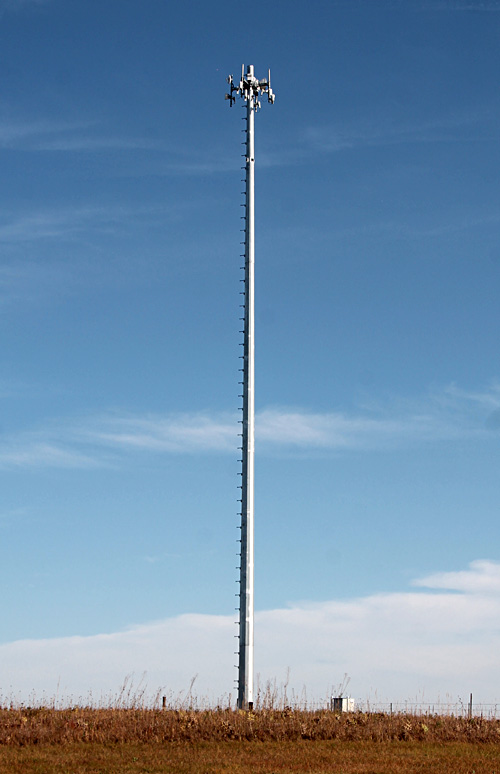
Some people in our experience have complained about wind-turbine visibility. However, few complain about tall radio and cell-phone towers that have spouted like mushrooms in recent years from hill tops throughout the state. Some are self-supporing; others have a network of guy wires and anchors. In our opinion, these towers are ugly eyesores, particularly those with truss frameworks. Such towers are responsible for an estimated 7 million bird deaths each year in the United States (GAO 2005). See wind myths.
The sonic environment, or soundscape, impacts human hearing in both urban and rural settings. Many people are subjected to loud sounds on a daily basis including traffic and construction as well as agricultural and industrial noises. Some people, in fact, willingly expose themselves to extreme noise levels. Immediate hearing loss may occur from sharp, singular sounds at >140 dB, and permanent hearing loss could happen with only 5 minutes exposure to 105-110 dB, for example at loud sports or music events (Elliott 2022).
The typical set-back distance for wind turbines from rural residences is at least 1000 feet. In our experience, noise from large, modern turbines is only slightly noticeable at this distance and rarely rises above background noise levels.
Bird mortality at wind farms has gained considerable public attention in recent years, but the plight of bats is less appreciated (Aber et al. 2015). Migratory tree bats have the greatest risk for wind-turbine mortality, particularly the hoary bat (Lasiurus cinereus), eastern red bat (Lasiurus borealis), and silver-haired bat (Lasionycteris noctivagans), all of which reside in or migrate across Kansas. The Red Hills is especially important for many bat species. This region has numerous caves and is considered among the most valuable in the United States for bat biodiversity. Obermeyer et al. (2011) recommended a 15-mile buffer around the Red Hills bat caves, and no wind farms are located in this region.
An estimated 14,000 barrels of diluted bitumen (dilbit) gushed out, covering several acres and flowing into Mill Creek—see Reuters. Unlike normal petroleum, which floats on water, dilbit sinks and is, therefore, much more difficult to remove from polluted streams. A long-planned and highly controversial expansion of this pipeline, known as Keystone XL, was finally abandoned in 2021 after President Biden denied a key permit for its construction across the U.S-Canadian border (Denchak and Lindwall 2022).
Kansas was formerly a major source for coal in the late 19th and early 20th centuries, particularly from numerous coal beds in the Cherokee Lowlands and Osage Cuestas (see above). Coal was used mainly for powering steam locomotives, smelting lead-and-zinc ore, and generating electricity. However, most coal mines ceased operating in the mid-20th century, and the last coal mine in Kansas shut down in 2016.
Since coal mining has ended in Kansas, natural gas has experienced considerable growth. Numerous sources of natural gas are found in Kansas, including a sizable portion of the huge Hugoton Gas Area, which is among the largest gas fields in the world. As a relatively clean fuel in abundant supply, electric utilities have turned increasingly to natural gas.
The Emporia Energy Center, for example, is a natural-gas-fired generating station designed to operate during high-peak-demand periods, such as hot summer days. It was put online in 2008 and had a nameplate capacity of 730 MW in 2021 (EIA 2022). However, natural gas is inherently dangerous, as demonstrated by the massive explosion and fire at the Haven Midstream Gas Plant between Hutchinson and Wichita on April 14, 2022—see Haven gas explosion.
Nuclear energy underwent rapid development during the mid-20th century with the promise of cheap, clean, and virtually unlimited supply. Kansas has one nuclear power plant, the Wolf Creek Generating Station near Burlington in Coffey County. The station went online in 1985, and is licensed to operate until 2045. Its nameplate capacity was listed at 1268 MW in 2021 (EIA 2022). However, the allure of nuclear energy has faded with concerns about safety, mining, proliferation, high cost, and disposal of nuclear wastes (Aber et al. 2015).
According to Musgrove (2010), all the energy used in a wind turbine's construction, installation, operation and eventual decommissioning is repaid by its energy output during its first few months operation. Wind energy, thus, represents a relatively fast return on investment compared with conventional power plants.
Solar-energy power plants have proliferated mainly in the sunny Southwest; whereas, wind energy has grown most in the eastern Rocky Mountains, Great Plains and Midwest regions. These trends likely will continue through the 2020s. Solar, wind, and natural gas will supply increasing shares of total electricity generated in the United States. Construction of new coal-fired or nuclear power plants seems unlikely or quite limited for the foreseeable future.
These shifts in energy sources are reflected likewise in large declines of carbon, sulfur, and nitrogen emissions into the atmosphere. Carbon dioxide, a principal greenhouse gas, fell by nearly one-quarter in the most recent decade.
Vestas was a relatively small Danish company that manufactured agricultural equipment and hydraulic cranes in the 1970s. Vestas acquired the designs and rights for the Herborg Vind Kraft (HVK) machine, which was the prototype for all modern wind turbines, and commercial production began in 1979 (Musgrove 2010).
Vestas grew rapidly and became one of the world's largest wind-energy companies. Vestas Wind Systems is headquartered in Aarhus, Denmark. The company has manufacturing facilities around the world, including three plants in Colorado for nacelles, blades, and towers—see Vestas North America.
Siemens Gamesa illustrates the trend toward consolidation and international reach of modern wind-power companies. Gamesa had its start in Spain in 1976 as an industrial and technology company, and it entered the wind industry in partnership with the Danish company Vestas in 1993. Danregn Vindkraft began manufacturing wind turbines in Denmark in 1980 and soon changed its name to Bonus. Both companies expanded rapidly into international markets in the late 1990s and early 2000s.
Siemens (a German company) acquired Bonus Energy in 2004. In the United States, Siemens opened a turbine-blade factory in Fort Madison, Iowa (2007) and a nacelle assembly plant in Hutchinson, Kansas (2010). Gamesa and Siemens merged in 2017 to form Siemens Gamesa Renewable Energy (SGRE) with headquarters in Spain.
Suzlon was founded in 1995 by Shri Tulsi Tanti in connection with his family's textile company in order to overcome India's unreliable and expensive electricity. Wind turbines soon became even better business than textiles (Yale 2024). In 2004, Per Hornung Pedersen was hired from Denmark to lead Suzlon into the global market, and the company expanded rapidly thereafter. As of 2021, Suzlon had installed turbines in 17 countries in Asia, Australia, Europe, Africa and the Americas—see Suzlon.
Fossils fuels, on the other hand, are available everywhere and reliable. Affordability varies with geographic, political and economic circumstances, however, and price varies considerably. The extraction of fossil fuels represents mining non-renewable resources. Furthermore, refining and burning these fuels contributes to atmospheric pollution and potential global warming.
Nuclear power has great promise for green energy, but also has many intractable issues of mining, safety, disposal of waste, proliferation, and public acceptance. Hydropower is clean and renewable, but large projects displace people, disrupt drainage systems, cut off downstream sediment, and impede migrating fishes. It's unlikely any significant new nuclear or hyrdopower would be developed in the United States. In other words, each major energy resource has notable strengths and weaknesses—no current nor any near-future energy source is ideal.
The fact is the world will need much more energy of all types to support and raise the overall living standard for some 10 billion people by the end of this century. The fundamental challenge is how to develop affordable energy resources that do not contribute to atmospheric pollution and potential climate change. Wind energy and natural gas are not competitors; they benefit each other because they compensate for one another. Wind energy is variable on a local basis, but this averages out over large regions, and cost is stable.
On the other hand, natural gas is reliable and available, but the price is highly volatile, as seen during the Texas energy crisis in 2021. During the first three months of 2022, as another example, the cost of natural gas in the U.S. increased by more than 50% (Nasdaq 2022), presumably in response to Russia's invasion of Ukraine. Thus, natural gas and wind solve each others reliability and price challenges (Webber 2012).
No single energy resource is sufficient; rather, a combination of resources may lead to a robust, reliable, cost-effective, and environmentally neutral energy supply. In other words, a balanced or radical-middle approach to energy is necessary for the 21st century (Tinker 2013). This is not a simple undertaking as many costs are not obvious and possible impacts are uncertain.
The switch from one primary energy source to another historically has taken several decades. Three such transformations have occurred during the Industrial Age, and the timing has varied from country to country (Smil 2014). The transition from wood to coal took place for some countries in the 19th century, although not until the mid-1900s for India and China. Coal remained the primary fuel throughout the 20th century, in spite of the dramatic growth of petroleum, the second transformation. A third transformation is underway now, led by Denmark and the United States, from coal and oil to natural gas and renewable energy (see above).
Given this historical context, wind energy has a long way to go both for technical and financial reasons. Aside from Denmark, an early and continuing advocate for wind energy, most other countries did not start serious wind-power developments until this century (see above). Major challenges confront the widespread usage of wind energy (Smil 2014).
Susan E. W. Aber – San José State University, California, Emerita. Former Director of the Science and Math Education Center and Peterson Planetarium at ESU. Dr. Aber’s interests are mineralogy, gemology, and energy resources, as well as maps and GIS for librarians.
Text and images © J.S. Aber and S.E.W. Aber. All rights reserved.
History and global status
Wind power is a form of green energy that requires no fuel to generate electricity and emits no pollution to the air, water or ground. Like sailing ships on the high seas, wind turbines have the potential to harness the wind for useful applications. We have a long-standing interest in wind energy particularly for Kansas and Denmark. Wind energy for generating electricity was pioneered in Denmark by Poul la Cour (1846-1908), who is considered the Danish Edison. His work in the 1890s led to the first Golden Age of Danish wind power in the early 1900s.
![]() Early Danish wind turbines
Early Danish wind turbines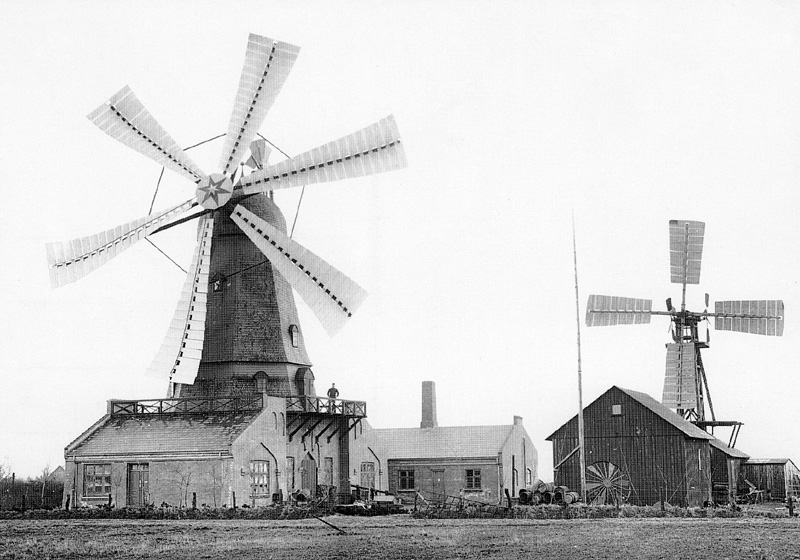
Windmills built by Poul la Cour for generating electricity at Askov in southwestern Denmark. First mill (right) was erected in 1891 and a larger mill (left) was built in 1897. Note person for scale beside larger windmill. Photo dates from about 1900; from a postcard obtained at the Danish Energy Museum.
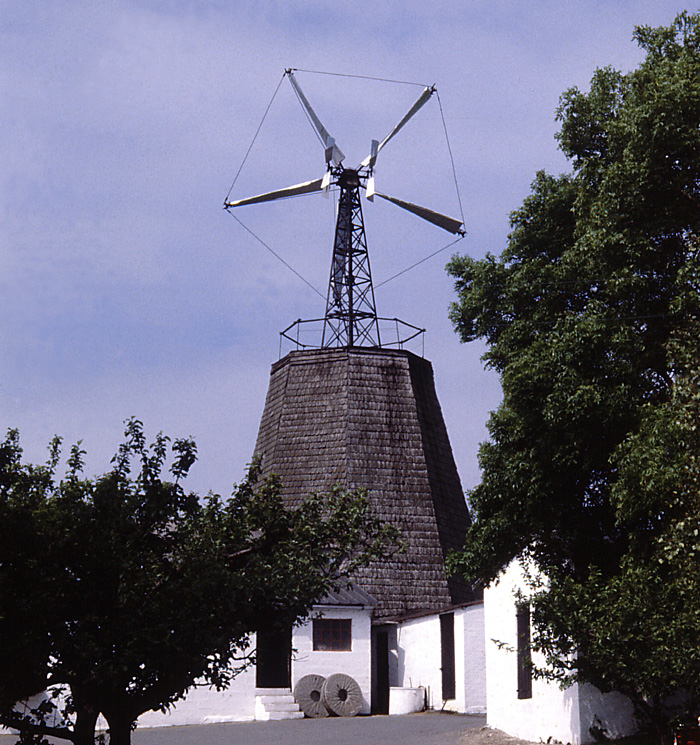
Agricco five-bladed wind turbine mounted on the base of an older traditional windmill at Olsker, island of Bornholm, Denmark. This mill was in service from 1927 until the late 1960s (Christensen 2016). Seen here as it appeared in 1979.
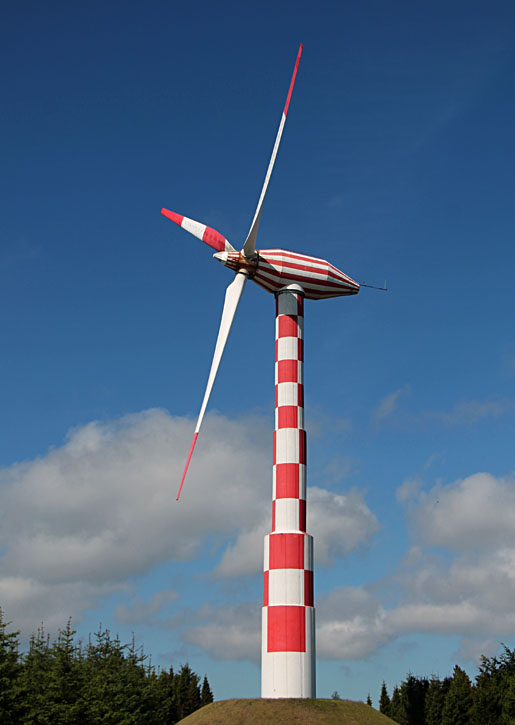
Tvind wind turbine was built in 1975-78. For many years, it was the largest wind turbine in active service worldwide and is still operating today (Tvindkraft 2022). It demonstrated the potential for industrial-scale wind energy. The concrete tower is 53 m (~172 feet) tall; the rotor is 54 m (~175 feet) in diameter and positioned on the downwind side of the nacelle and tower. The red-and-white color pattern was applied to celebrate the turbine's 25th anniversary in 2003.
Rounded values in gigawatts (GW) from IRENA (2024). ![]() Top 12 countries for wind-energy capacity
Top 12 countries for wind-energy capacity
Through the end of 2023; both onshore and offshore.Country Installed GW Country Installed GW
China Brazil
United States France
Germany Canada
India Sweden
Spain Turkey
United Kingdom Australia ![]() Back to beginning.
Back to beginning.Kansas windscape
Kansas has played a prominent role in the development of United States wind power. Like other Great Plains states, Kansas is well known for wind. Dodge City is the most windy city in the contiguous (48) United States, in fact, and Goodland is the fifth most windy city (Aber and Aber 2020). The largely rural, treeless, windswept landscape of Kansas is ideal for further development of wind energy. Other essential factors for siting wind farms include topography and electrical transmission lines as well as environmental, cultural, health, aesthetic, and political aspects. Together these factors make up the windscape.
Data from WINDExchange (first quarter 2024).![]() Top 12 states for installed wind-energy capacity
Top 12 states for installed wind-energy capacity State Installed GW State Installed GW
Texas Colorado
Oklahoma Minnesota
Iowa New Mexico
Kansas Michigan
Illinois North Dakota
California South Dakota
Rounded values given in gigawatts (GW). ![]() Back to beginning.
Back to beginning.Kansas wind history
Wind energy has been exploited in Kansas since early days. Traditional European-style windmills were built across the United States, including some in Kansas, which were used mainly for grinding grain. The conventional American windmill was invented in the mid-1800s and quickly spread by the tens of thousands in myriad forms across the Midwest and Great Plains. Its primary use was for pumping groundwater. In contrast to European windmills, American windmills have many blades in their wheels, at least a dozen to more than 100 blades in some models.
![]() Traditional Kansas windmills
Traditional Kansas windmills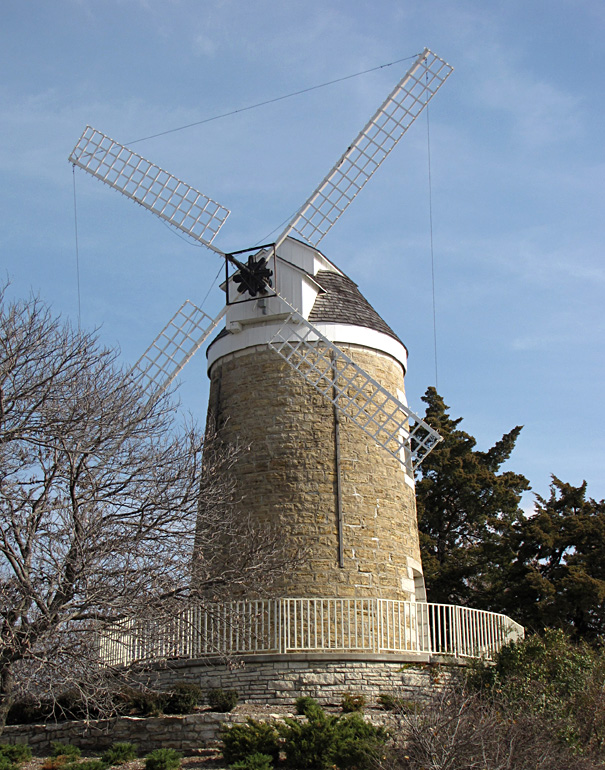
Left – Old Dutch Mill in Wamego, Kansas. The stone-tower mill was built in 1879 about 12 miles north of Wamego and used for grinding wheat and corn. The mill was taken down and rebuilt in Wamego in 1925 as a historical monument. The sail frames are decorative and non-functional. 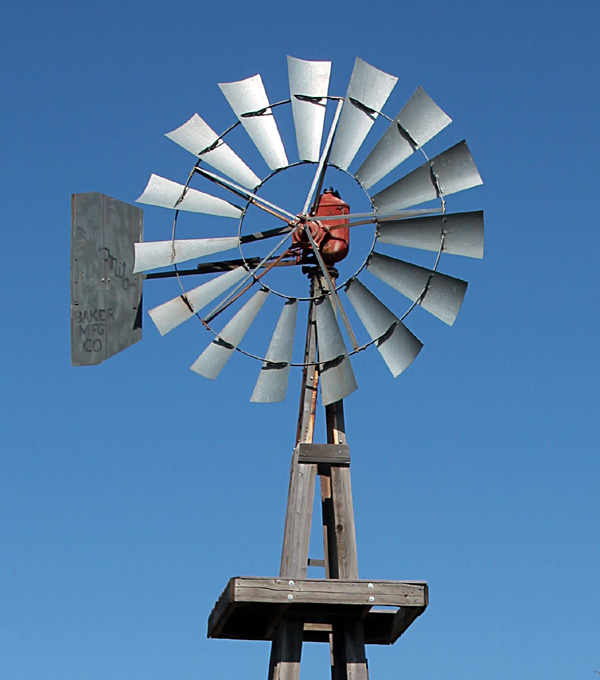
Restored Raymond vaneless windmill at Kinsley, Kansas. This model was among the most common vaneless windmills across the Midwest and Great Plains in the late 1800s and early 1900s (Baker 1985). 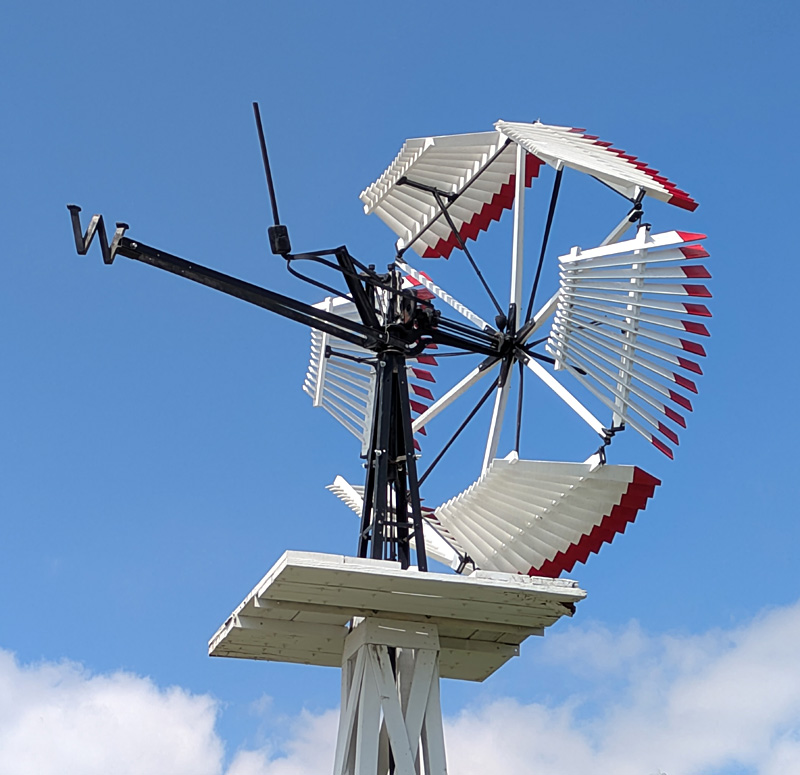
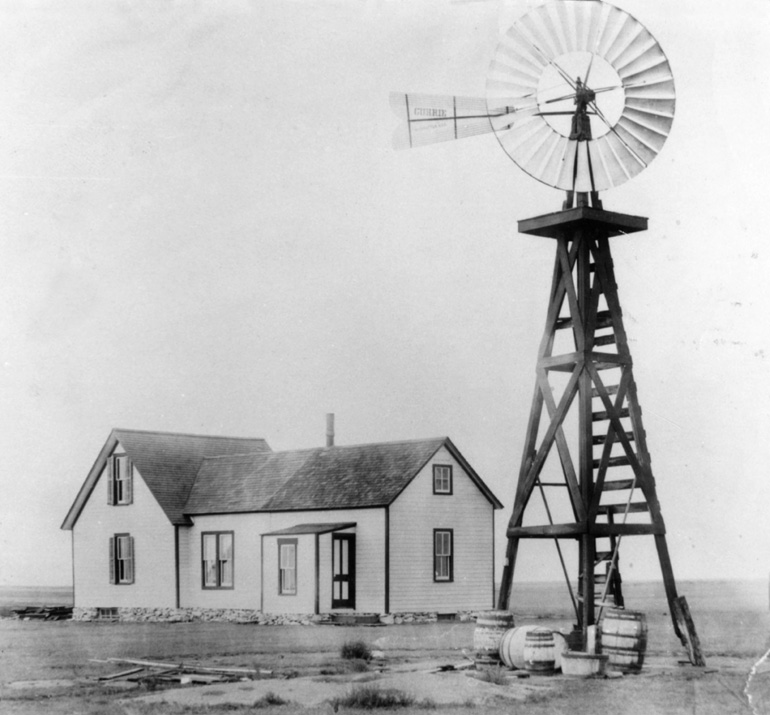
Left – The importance of pumping groundwater is depicted by this historic farmstead. The Currie windmill was made in Kansas and featured a large wheel with 30 blades. Notice the wooden water barrels at the bottom. The mill presumably dates from the 1890s; photo obtained from the Horace Greeley Museum in Tribune. 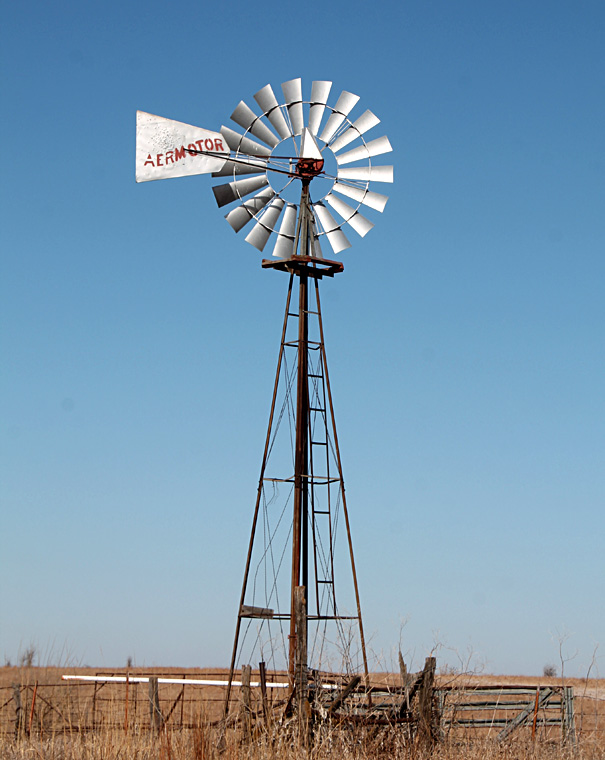
Gray County Wind Farm was the first large wind-energy facility in Kansas built on the High Plains in 2001. Vestas V47 turbines—see below. Kite aerial photograph by the authors (2006).
![]() Back to beginning.
Back to beginning.Kansas wind assessment
Clearly wind power has emerged in just two decades as a major energy resource for Kansas. As of mid-2024, Kansas had approximately 4200 wind turbines deployed in 48 large wind farms. The following assessment and review of the Kansas windscape is based for the most part on our previous publications in the Transactions of the Kansas Academy of Science (Aber and Aber 2012, 2016, 2020), as well as Windscapes: A global perspective on wind power (Aber, Aber & Pavri 2015), Kansas windscape: Wind energy in the 21st century (Aber and Aber 2024), Wind energy landscape: Principles, techniques, history (Aber, Aber & Pavri 2026), and many other cited references. ![]() Complete listing of large Kansas wind farms (2024).
Complete listing of large Kansas wind farms (2024).
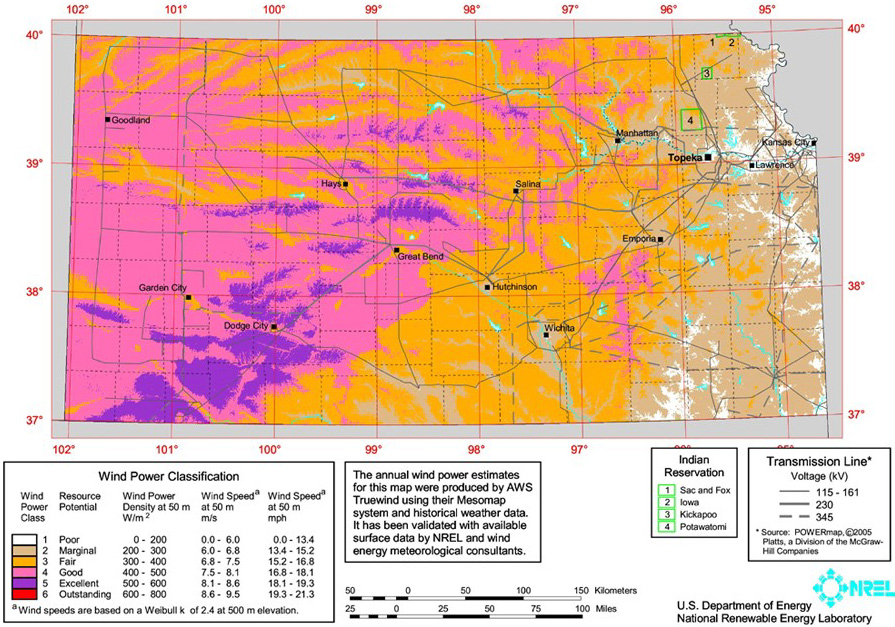
Kansas average annual wind speed at 50 m (160-foot) height. Most of the western three-fourths of Kansas is rated fair to excellent. Adapted from WINDExchange (2008).
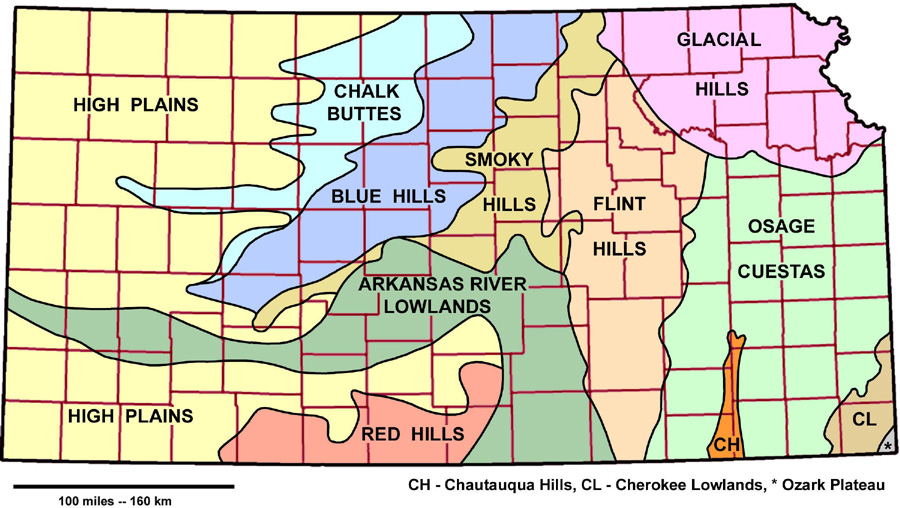
Landscape regions of Kansas. Region limits are sharp and well defined in some cases, but may be transitional or gradual in other places. County boundaries shown in maroon. Adapted from Aber and Aber (2009).
![]() Kansas drainage basins
Kansas drainage basins 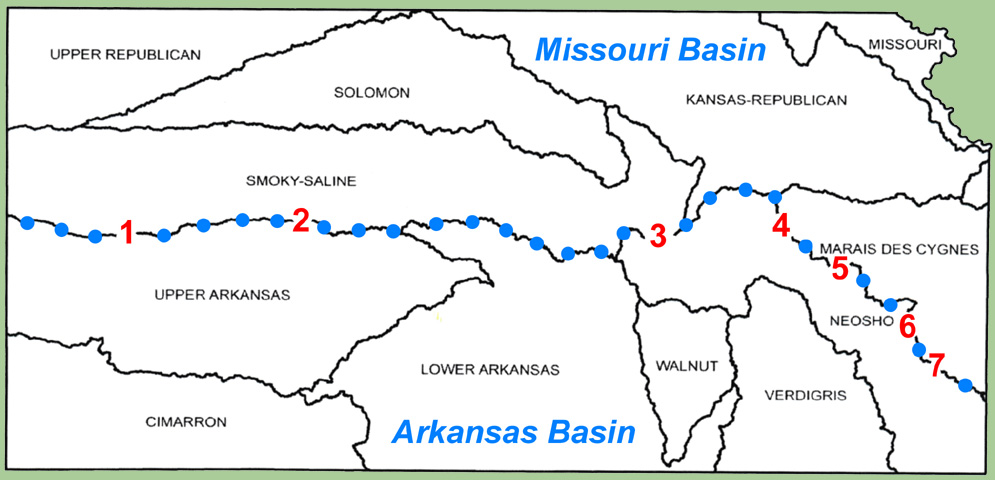
Blue dots mark the master drainage divide between the Missouri River and Arkansas River basins. See table below for numbered wind farms. Adapted from Goodrich, Jacobs and Miller (2022, fig. 2).
Based on the U.S. wind turbine database (USWTD 2022). Average wind speed in meters![]() Wind farms on the Missouri-Arkansas drainage divide
Wind farms on the Missouri-Arkansas drainage divide
Arranged from west (top) to east (bottom)
Across Kansas into southwestern MissouriWind farm Region County Wind speed Turbine type & capacity Year
1. Central Plains High Plains Wichita 8.0-8.5 m/s Vestas 3.0 MW 2009
2. Cedar Bluff High Plains Ness 8.5-9.0 m/s GE Wind 1.79 MW 2015
3. Diamond Vista Smoky Hills Marion 8.0-8.5 m/s Nordex 3.15 MW 2018
4. Reading Osage Cuestas Lyon, Osage 7.5-8.0 m/s Siemens Gamesa 2.4 & 3.5 2020
5. Waverly Osage Cuestas Coffey 7.5-8.0 m/s Gamesa 2.1 MW 2015
6. Prairie Queen Osage Cuestas Allen 7.5-8.0 m/s Gamesa 3.55 & 2.625 MW 2019
7. Jayhawk Osage Cuestas Bourbon 7.5-8.0 m/s GE Wind 2.82 MW 2021
8. North Fork Ridge Osage Plains Barton (MO) 7.0-7.5 m/s Vestas 2.2 MW 2020
9. Kings Point Springfield Plateau Jasper (MO) 7.0-7.5 m/s Vestas 2.2 MW 2021
per second (m/s) at 80 m (250-foot) height (WindExchange 2010). Turbine capacity
given in megawatts (MW). Adapted from Aber and Aber (2020).
Marshall Wind Energy complex in the western Glacial Hills. Vestas V110-2.0 MW turbines; towers stand 95 m (~310 feet) tall and rotor diameter is 110 m (~360 feet). The turbines are located on a local drainage divide, known as the Summit, between the Roubidoux Creek basin to the west and North Fork Black Vermillion River basin to the east. This wind farm began operation in 2016.
![]() Back to beginning.
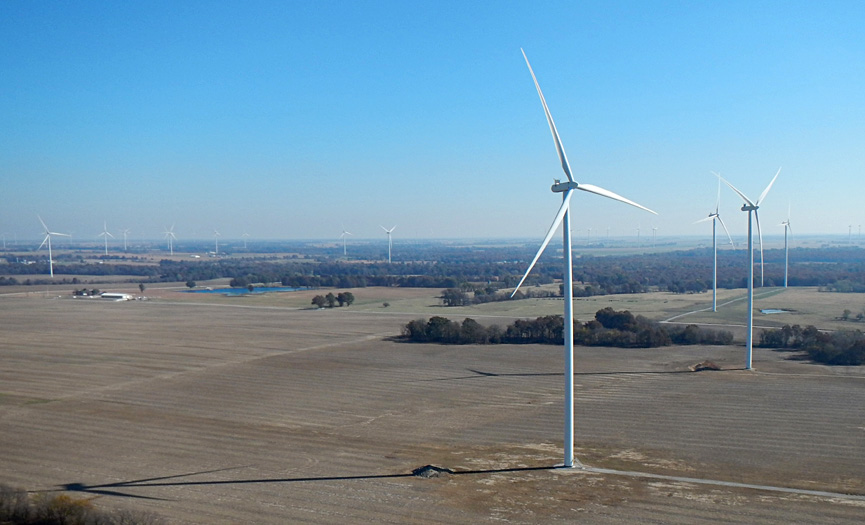
Back to beginning.KAP of selected wind farms
We have conducted kite aerial photography (KAP) at several wind farms across Kansas beginning in 2006 and more recently in southwestern Missouri. The following selected wind farms are presented in order of their construction and operational age.

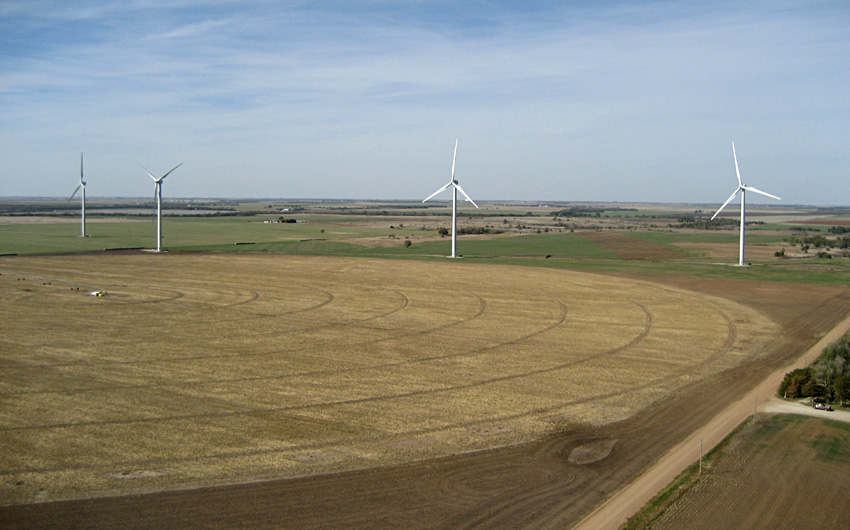
Turbines are deployed in east-west lines along field boundaries in order to minimize impact on crops. Turbines are closely spaced about 520 feet (~158 m) apart. Green fields are winter wheat in this early spring view. KAP (2006).

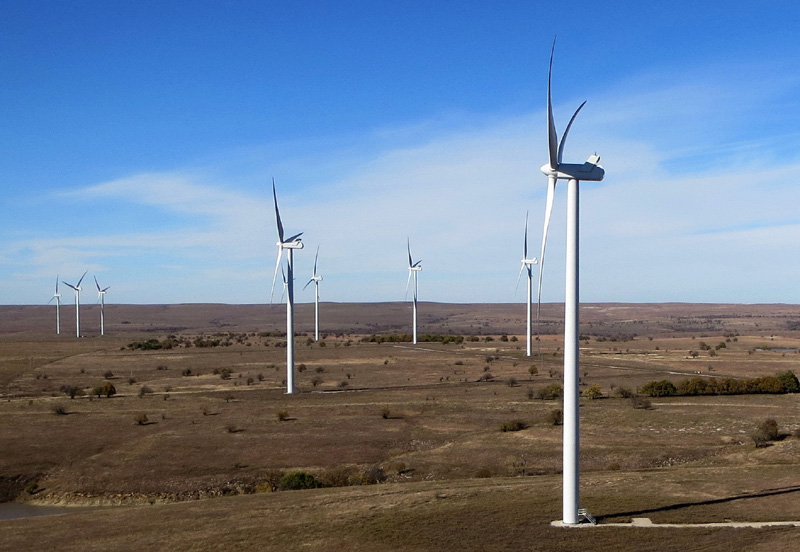
Elk River Wind Farm occupies the drainage divide at the crest of the Flint Hills near Beaumont in southeastern Butler County. Elevation exceeds 1600 feet here. Turbines are spaced about 700 feet (~214 m) apart. KAP (2009).
GE Wind 1.5 MW turbines amid agricultural fields. Towers stand 262 feet tall, and total height is just over 390 feet with a blade in the upright position. These GE turbines were made in the U.S. (components from Texas, Florida, & California); they are descendents of the Tacke turbine made in Germany during the 1990s—see below. KAP with D. Leiker and C. Unruh (2007).
Wind turbines are situated on the Greenhorn Limestone that caps ridge tops at the easternmost edge of the Blue Hills escarpment with I-70 in the background. Helium-blimp airphoto (2011).
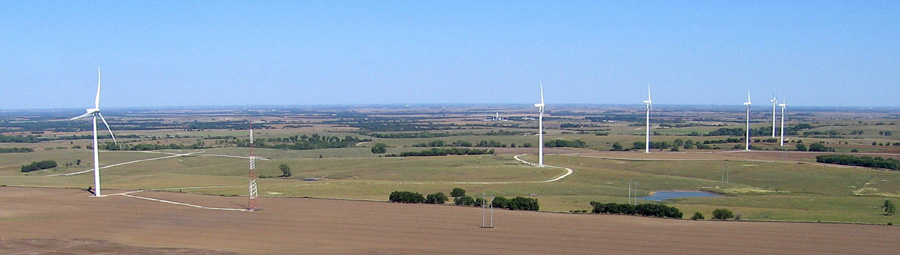
The eastern end of the wind farm in Cloud County. Note the weather tower (red and white), which is a feature of all wind farms for monitoring wind and other atmospheric conditions. KAP (2013).
This view shows the original Clipper C96 turbines that stand 420 feet tall with a blade in the upright position. Two closest turbines are spaced about 980 feet (~300 m) apart. Note the mixed land use with crops (green winter wheat) and grazing cattle (black dots) on prairie grass in this early spring view looking westward. KAP (2011).
Pair of Siemens Gamesa 2.4 MW turbines; total height is 134 m (~440 feet) with blade in upright position. Turbines are spaced about 1440 feet (~240 m) apart. KAP (2022) taken soon after spring burning of the tallgrass prairie.
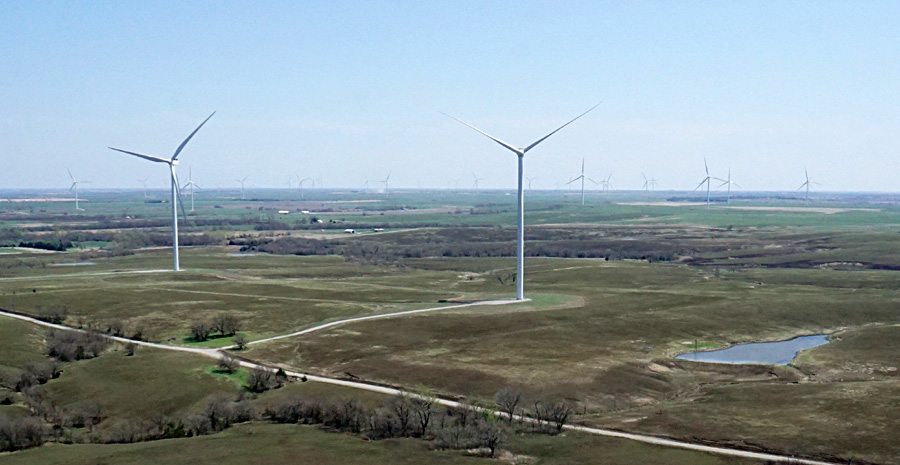
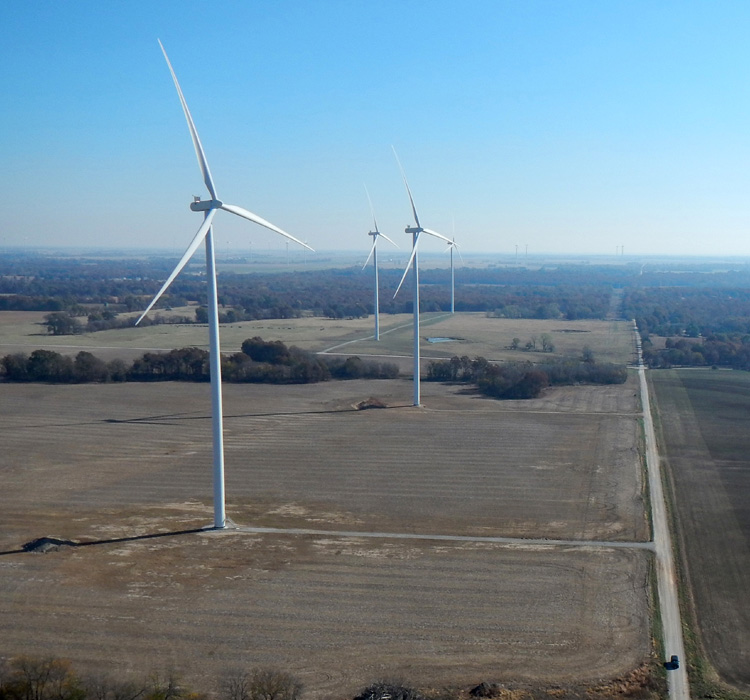
Overview (left) and closer shot (right). Vestas turbines stand 182 m (nearly 600 feet) tall with a blade in upright position. Note vehicle on the county road for scale. Two closest turbines are spaced about 1130 feet (~344 m) apart. KAP in autumn (2022).
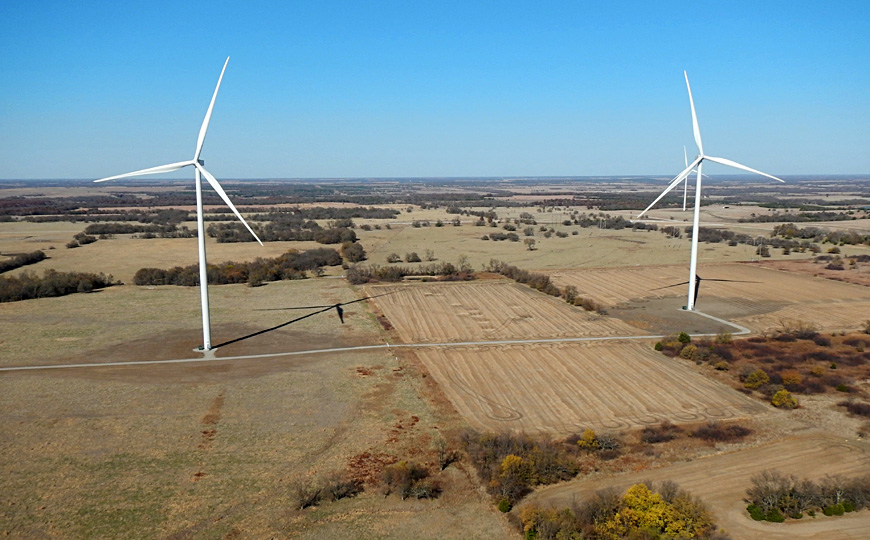
Western, higher portion (left). Two turbines are spaced about 1190 feet (~363 m) apart. Eastern, lower part (right). GE Wind turbines stand 177 m (580 feet) tall with blade in upright position. KAP in autumn (2022).
Dimensions in meters (rounded); based on Aber and Aber (2024).![]() Typical turbine characteristics in
Typical turbine characteristics in
selected large Kansas wind farms.
Year Wind farm Tower
height Rotor
diameter Maximum
height Spacing Capacity
(MW)
2001 Gray County
2005 Elk River
2009 Flat Ridge
2012 Flat Ridge 2
2017 Bloom
2019 Prairie Queen
2021 Iron Star ![]() Back to beginning.
Back to beginning.Turbine height
In the United States, the limiting height factor is Federal Aviation Adminstration (FAA) restrictions for structures that extend into the national airspace. In general, any structure standing more than 200 feet (61 m) above the ground requires FAA approval. This is usually not a problem up to 500 feet (152 m) in height, which is normally the lower flying limit for manned aircraft. For many years this was the de-facto height limit for turbines in the U.S. However, 500 feet is no longer an absolute height limit. According to current FAA guidelines for wind turbines:
Siemens Gamesa turbines stand 180 m (~590 feet) tall with rotors 132 m (~433 feet) in diameter. Rated capacity of each turbine is 3.55 MW. Prairie Queen wind farm was erected in 2019, Allen County, southeastern Kansas.
![]() Back to beginning.
Back to beginning.Small turbines
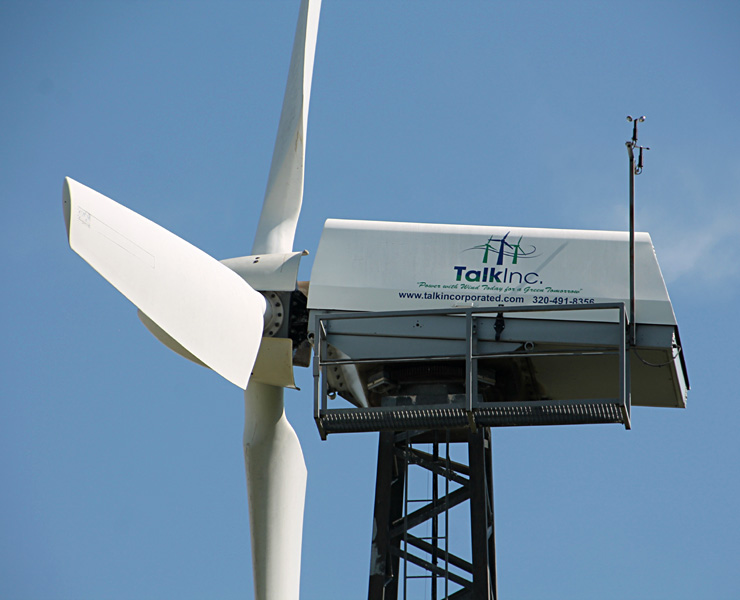
In addition to the large turbines shown above are smaller wind turbines scattered throughout the state; for example, three small Nordtank and Northern Power turbines operated by Cloud County Community College and Cloud Power in conjunction with a solar farm. Smaller turbines also serve individual farms and businesses. These turbines may be new, used, or remanufactured equipment, many derived originally from Denmark.
![]() Small turbines in central Kansas
Small turbines in central Kansas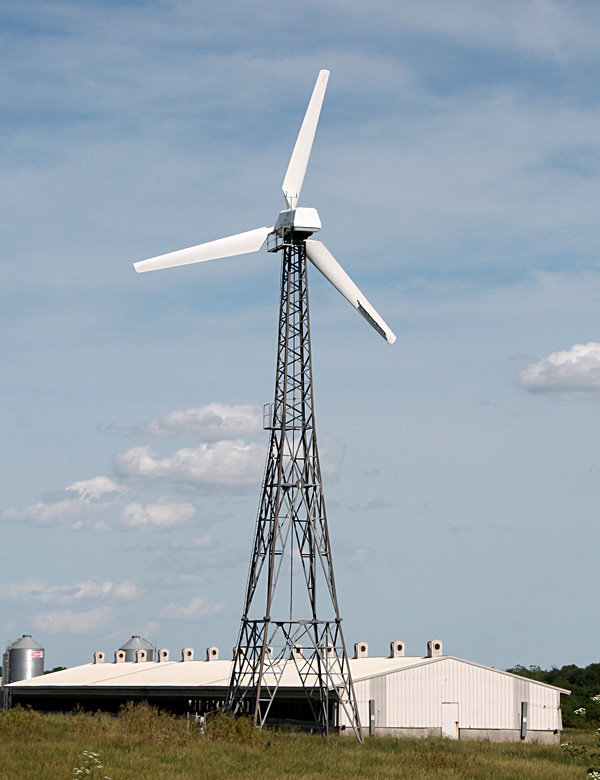
TalkInc wind turbine at a farm near Waverly. TalkInc turbines are remanufactured in Minnesota from previous equipment. This one is derived from a Windmatic model, which was built originally in Denmark during the 1980s.
Left: Wincon (or possibly Micon) turbine serves a small business in La Crosse. Manufactured in Denmark and imported to California wind farms by the hundreds in the 1980s. 
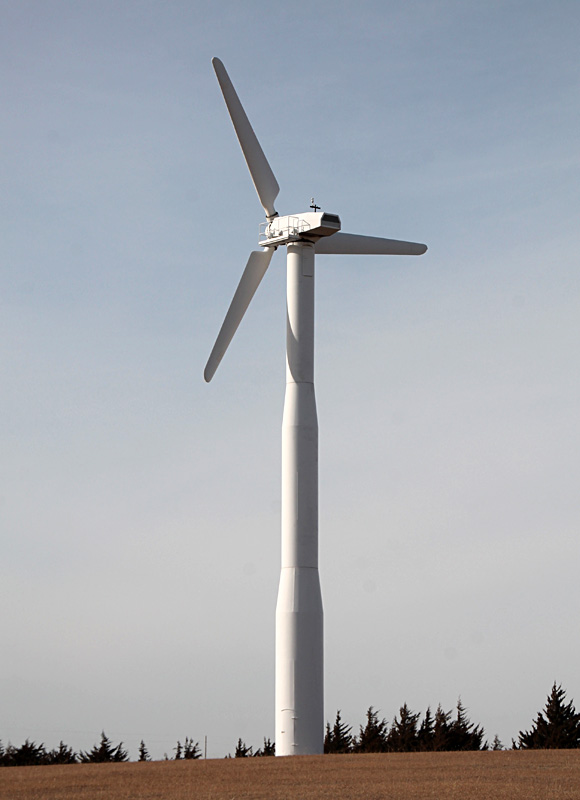
Left: Nordtank turbine on a farm near Hoisington. Nordtank machines were manufactured in Denmark, and more than 1000 were imported into California during the 1980s. Nordtank was the first company to use tubular steel towers. 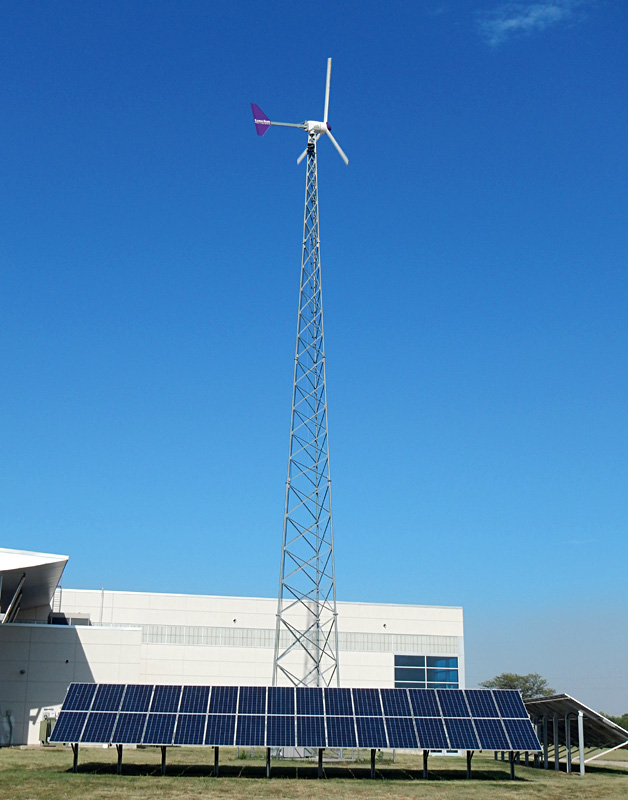
![]() Back to beginning.
Back to beginning.Wind-energy logistics
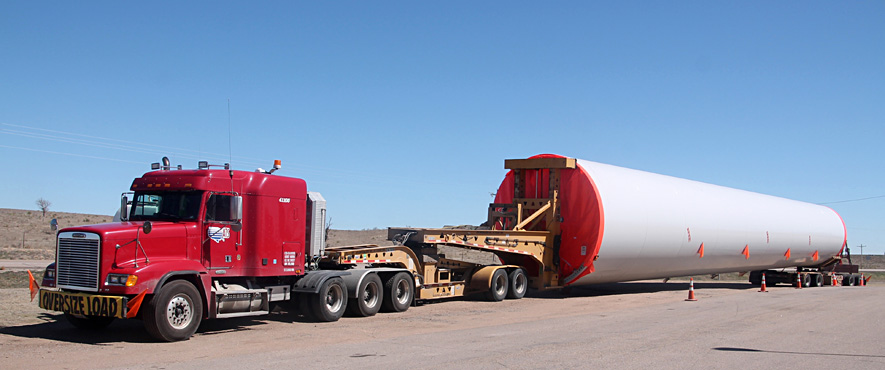
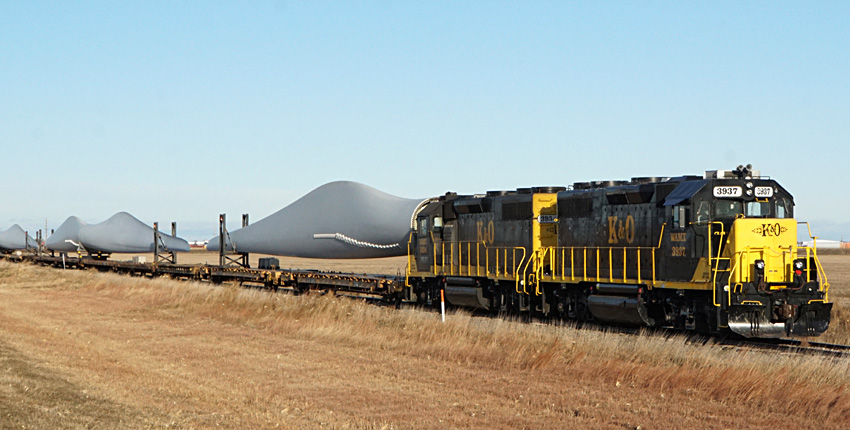
Rapid growth of wind energy has spurred development of support activities and infrastructure associated with the construction of wind farms. For example, a large transportation and logistics center serves southwestern Kansas from the BNSF Railway depot in Garden City. Several other logistics centers have been established by the BNSF Railway, Union Pacific Railroad, and K&O Railroad in various locations around Kansas. Turbine components are delivered via special railcars, off-loaded for temporary storage, and eventually transported by oversized tractor-trailer trucks to wind-farm construction sites.
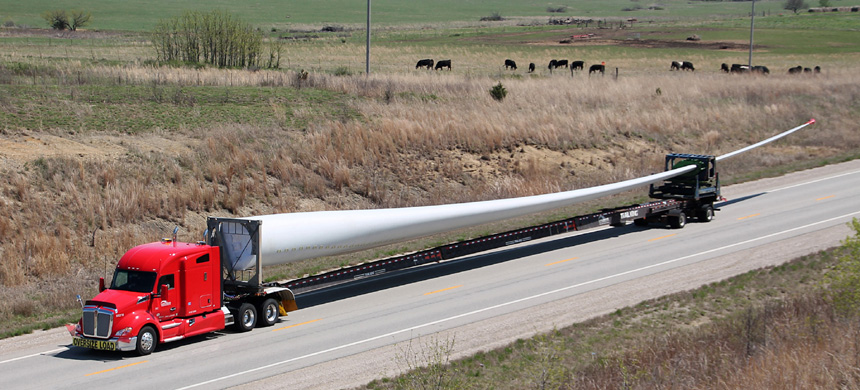
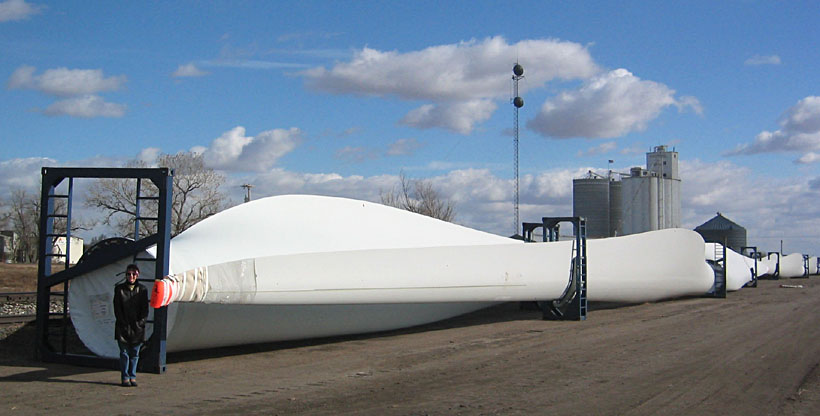
Blades are typically about 50-70 m (165-230 feet) or longer.
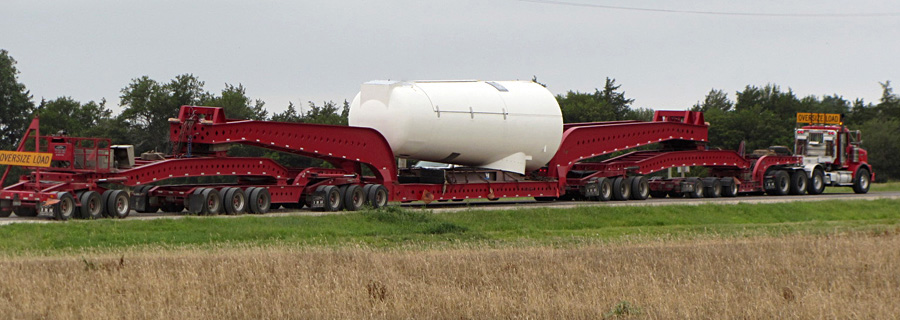
Siemens turbine nacelle (left) on US 281 highway in Stafford County near St. John (2014). The massive trailer rig has 60 wheels. The nacelle came presumably from the factory in Hutchinson. Turbine tower segment (right) at a rest stop on US 50/400 highway in Gray County near Ingalls.
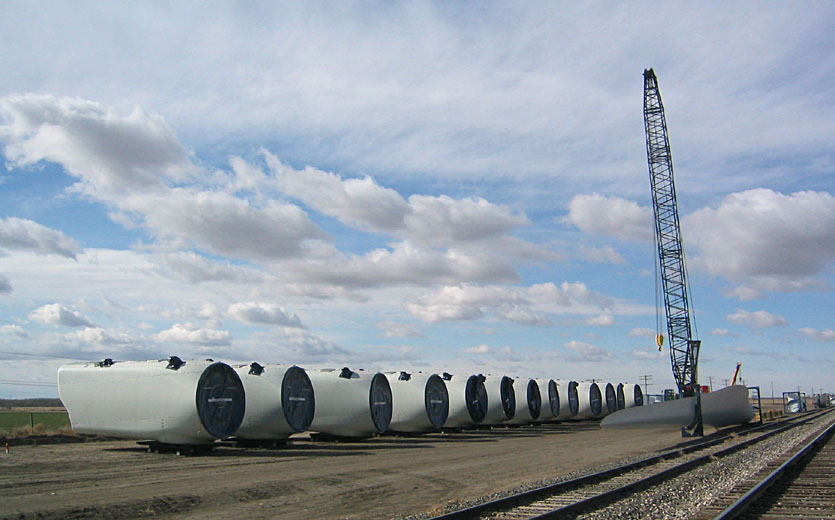
Temporary unloading depot beside the BNSF Railway in Syracuse (2008). Crane and Vestas V90 nacelles (left), and turbine blades (right). These components were headed toward construction of the Central Plains wind farm in Wichita County.
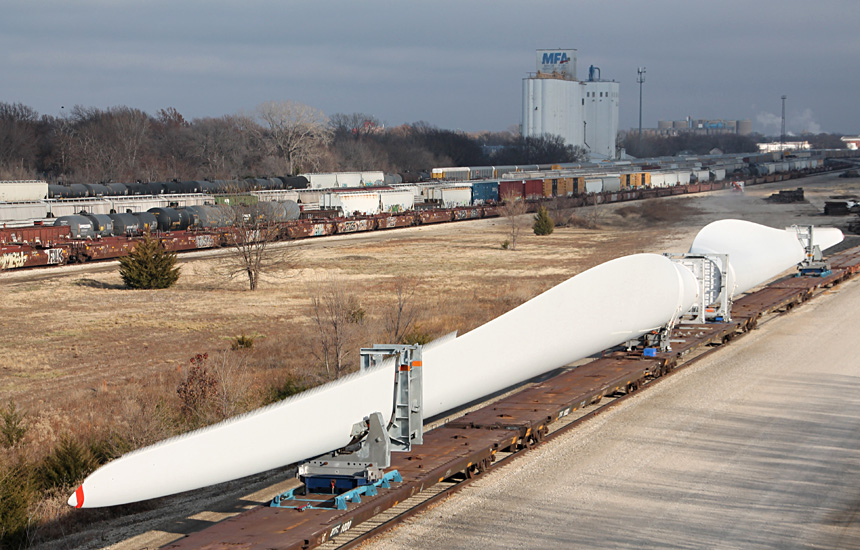
Left: turbine blades carried in special cradles spanning three flat-bed cars. BNSF Railway depot in Emporia. Right: turbine blades await unloading at the K&O Railroad depot near Larned.

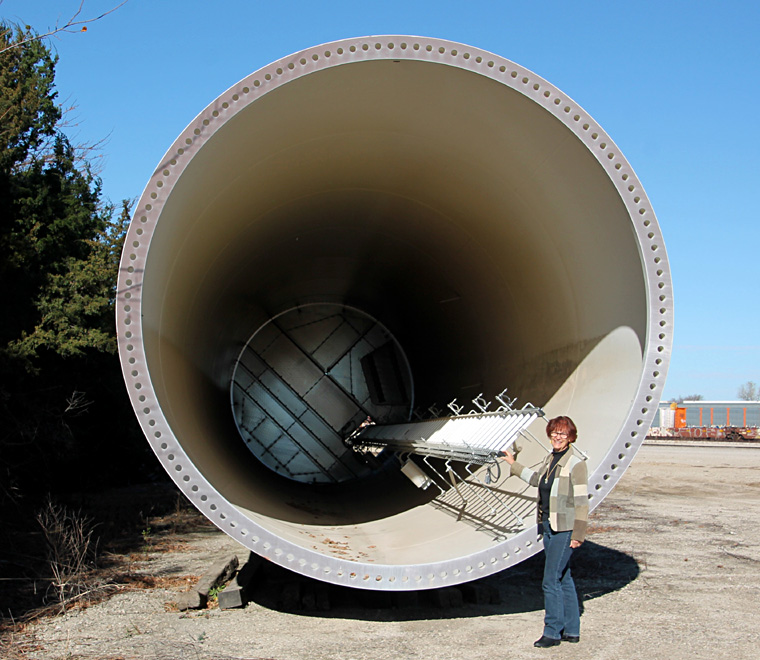
Gamesa wind turbine parts in the BNSF Railway depot at Emporia. Left: vertical view of turbine blades stored in a tight-packing arrangement. Service truck shows size of blades. KAP with D. Leiker (2017). Right: interior view of turbine tower segment, approximately 4 m (13 feet) in diameter. Note the inside ladder.
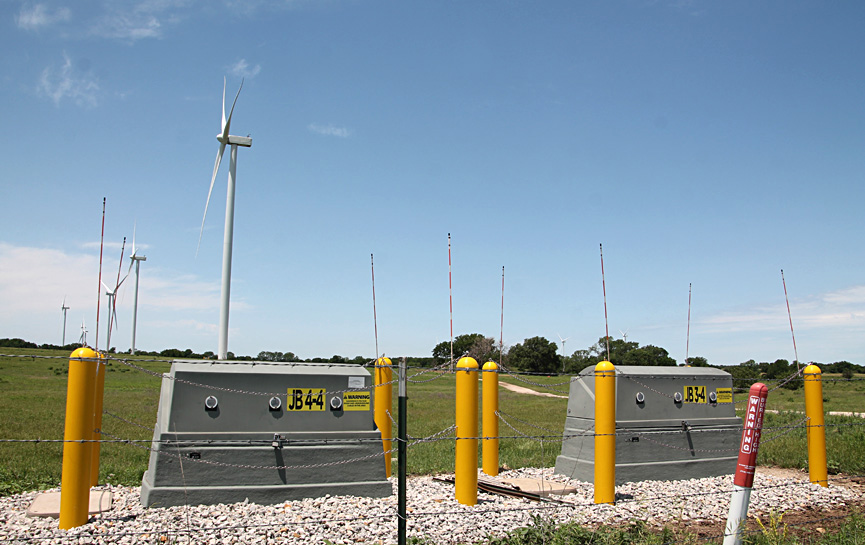
Left: transformers and buried high-voltage power lines connect individual turbines to the substation serving the Prairie Queen wind farm. Right: electrical substation and transmission line serving the Central Plains wind farm, Wichita County.
Left: transmission line in the original Spearville wind farm, Ford County. KAP with D. Leiker and C. Unruh (2008).
Right: high-capacity transmission line under construction for the Sunflower wind farm. This line crosses US highway 50 just west of Florence (2023).
![]()
![]() Back to beginning.
Back to beginning.
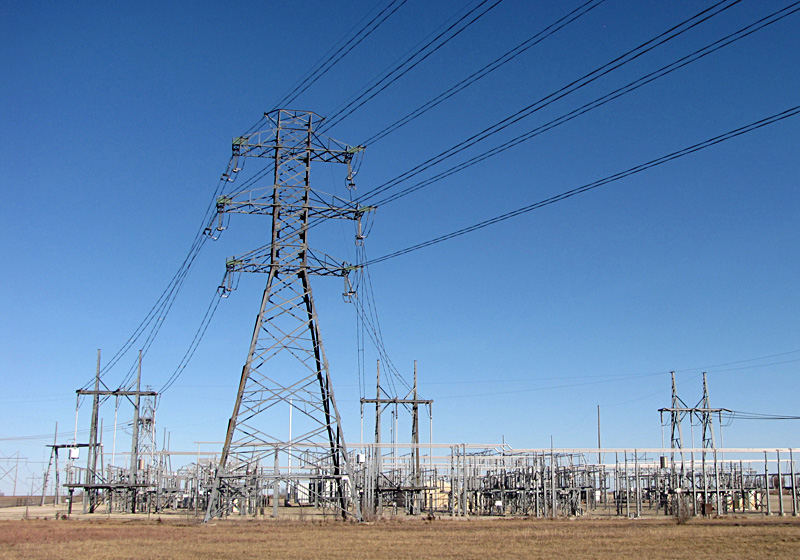
Electricity grid
In North America, electricity is distributed within linked grids of transmission lines, known as interconnections. Three of these serve the contiguous (48) United States plus parts of Canada and Mexico.
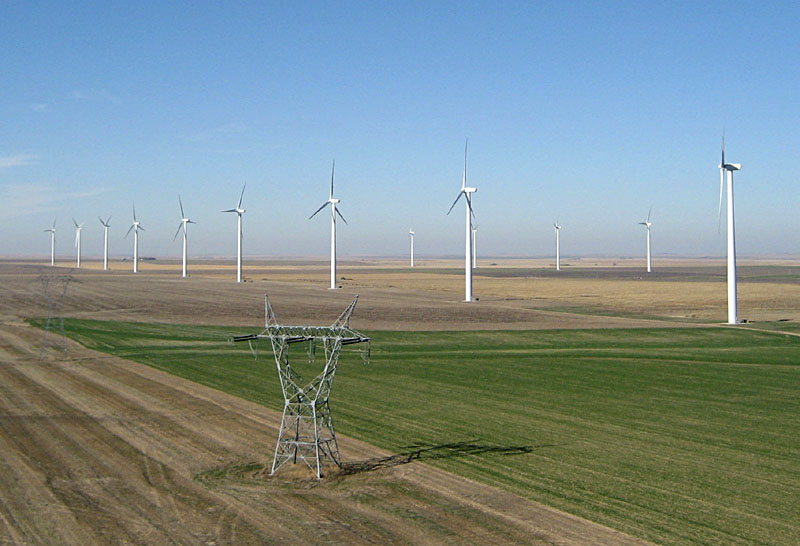
The dispersed nature of wind energy overcomes the vagaries of local weather (Aber et al. 2015). As weather systems move across the Great Plains, for instance, wind speed and direction shift so that some locales may have weak or calm conditions while others places have strong wind. Throughout the region some wind farms are generating at peak capacity, while others are operating at partial capacity, and a few are not generating on any particular day. Overall regional wind-power production continues to feed into the grid system to be used where needed.

lines in the Flint Hills of Kansas.
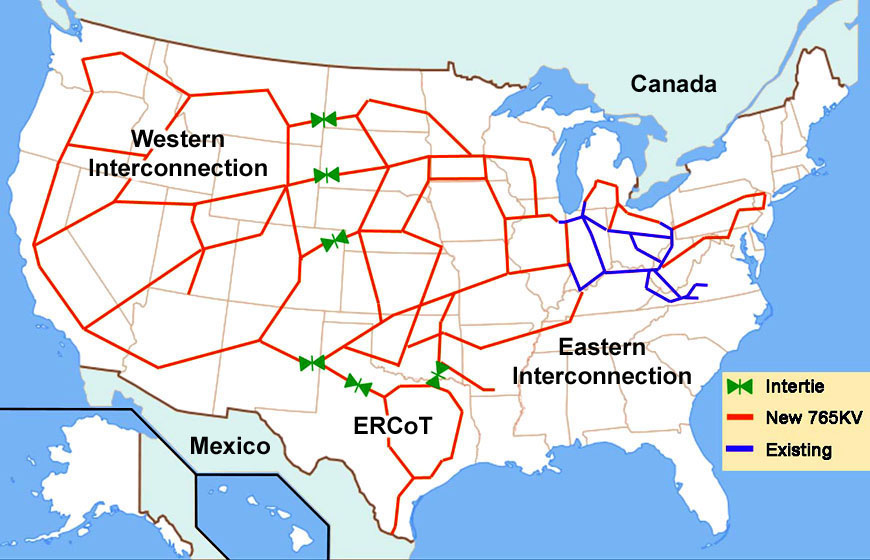
Super electrical grid using 765 kV AC transmission lines and interties. Proposed for the United States in 2008 by the American Wind Energy Association. Image adapted from Wikimedia Commons.
As these topics demonstrate, federal funding deals with engineering issues as well as social and environmental aspects for deploying wind energy. The Inflation Reduction Act of 2022 further supports development of clean energy through tax credits and consumer rebates. The bill includes 950 million solar panels, 120,000 wind turbines, and 2,300 grid-scale battery plants (White House 2022). However, the election of President Trump to a second term may lead to reduced fundng for renewable energy, including wind power.
![]()
![]() Back to beginning.
Back to beginning.Environmental and aesthetic issues
Although much of Kansas, as well as southwestern Missouri and eastern Colorado, are favorable for wind-energy development, some locales clearly are not suitable for various reasons, such as urban areas, nature preserves, and places with great aesthetic or environmental value. Wind farms are, in general, compatible with rural, agricultural rangeland and cropland, including both dryland and irrigated farming.
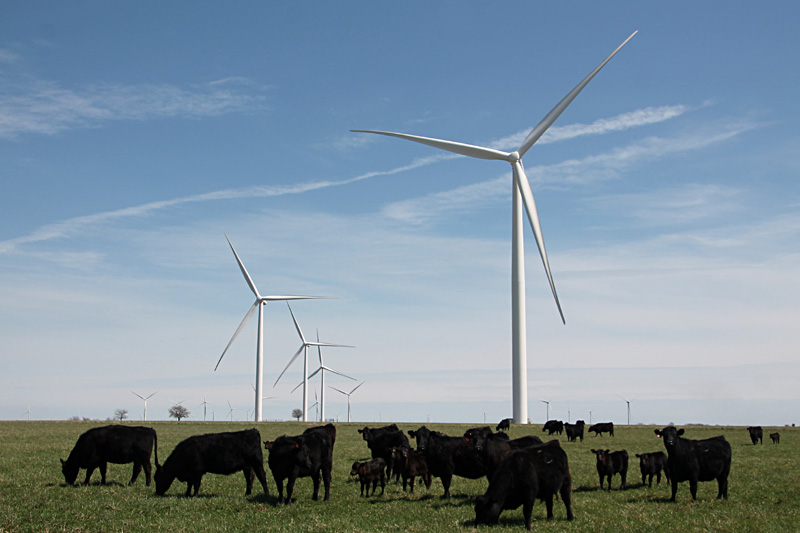
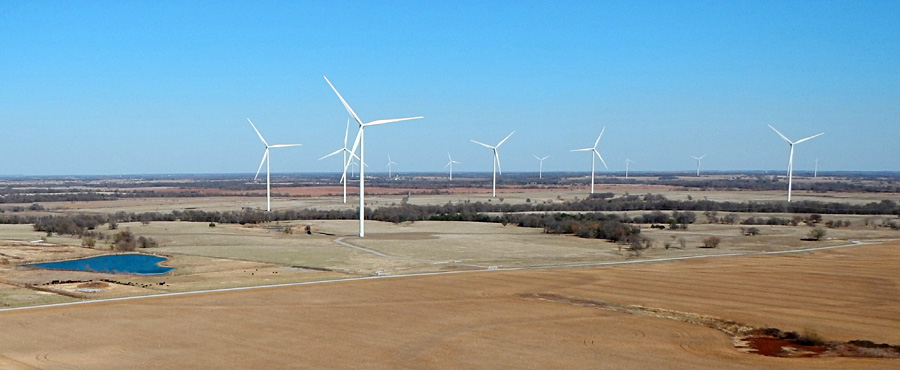
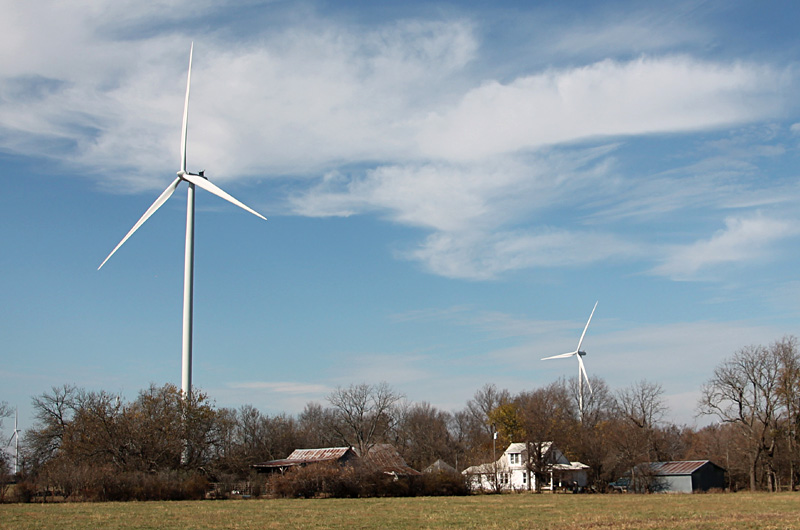
Cattle graze on newly emergent grass in tallgrass prairie (left) in the Reading Wind Facility. Turbines of the Flat Ridge Wind Farm (right) stand beside a center-pivot irrigation system on the High Plains.
![]() Tale of two counties – Reno and Harvey.
Tale of two counties – Reno and Harvey.
Caney River Wind Farm came online 2011 and is situated on a prominent escarpment of the Americus Limestone in western Elk County. The Flint Hills crest is visible on the western horizon. Vestas V90 turbines; the towers are 80 m (262 feet) tall, and the blades are 44 m (144 feet) long. This wind farm includes 111 turbines with a nominal generating capacity of 200 MW. KAP with J. Schubert (2013).
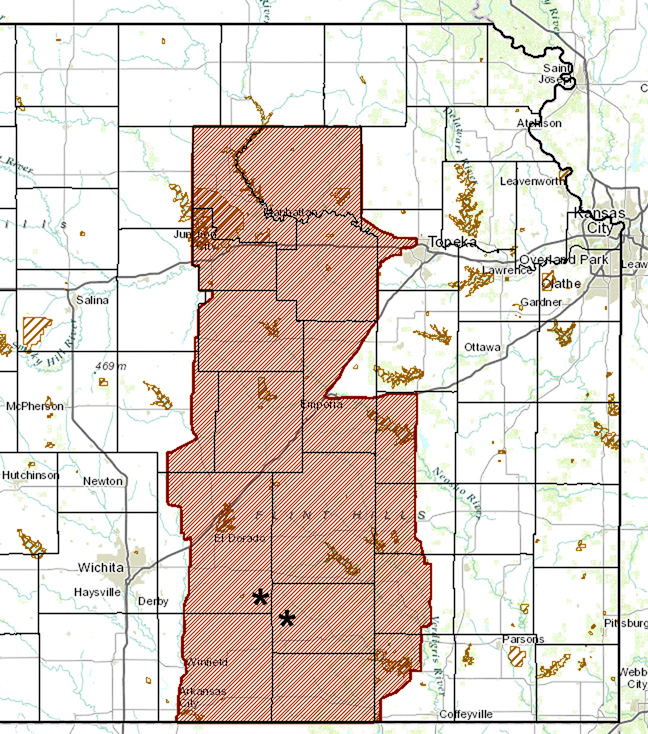
Tallgrass Heartland excusion zone for wind-farm development. Two pre-existing wind farms (*) are Elk River and Caney River. Map adapted from Aber, Aber and Pavri (2015).
![]() Typical radio/cell towers in the Flint Hills
Typical radio/cell towers in the Flint Hills
From Aber, Aber and Pavri (2015), USFRA (2020), Elliott (2022), and other sources.![]() Typical sound loudness
Typical sound loudnessSound type Decibel (dB)
Whisper
Wind turbine
Normal speaking
City traffic (inside car)
US train horn (min-max)
Motorcycle, snowmobile
Power mower at 1 yard
Symphonic music peak
Loud rock concert
NASCAR, drag racing
F1 racecar, chainsaw
NFL football game peak
Jet engine at 100 feet
Firecrackers
Shot gun blast
* sound limits for turbines typically
required by national or local regulations.
The large turbine on left is just over 1000 feet away from the farmstead. Vestas V120-2.2 MW turbine that stands 182 m (nearly 600 feet) tall with blade in upright position. Kings Point wind farm, Jasper County, southwestern Missouri.
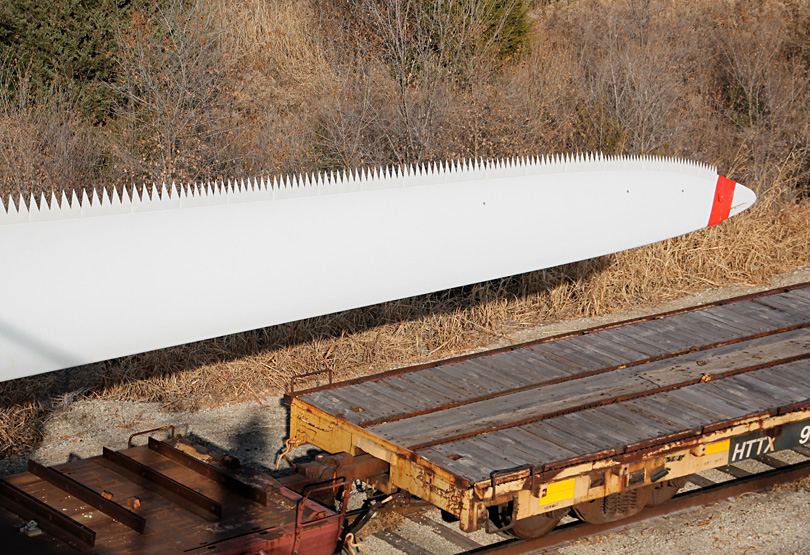
Serrated trailing edges on blades for Vestas (left) and GE Wind (right) turbines. Note the graduated size of teeth that become smaller toward the blade tip. BNSF Railway depots in Emporia and Garden City.

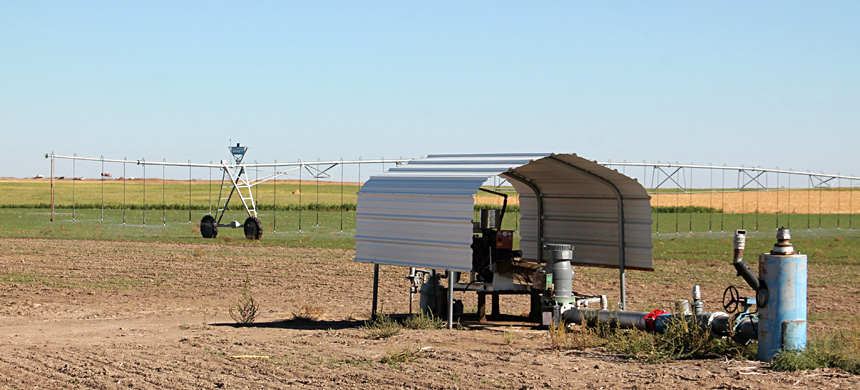
Unmuffled, gas-powered engine pumping groundwater from the High Plains Aquifer in Wallace County, westernmost Kansas. The noise resembles a race car (130-150 dB) and is almost unbearable nearby. Thousands of such irrigation pumps are found throughout the state.
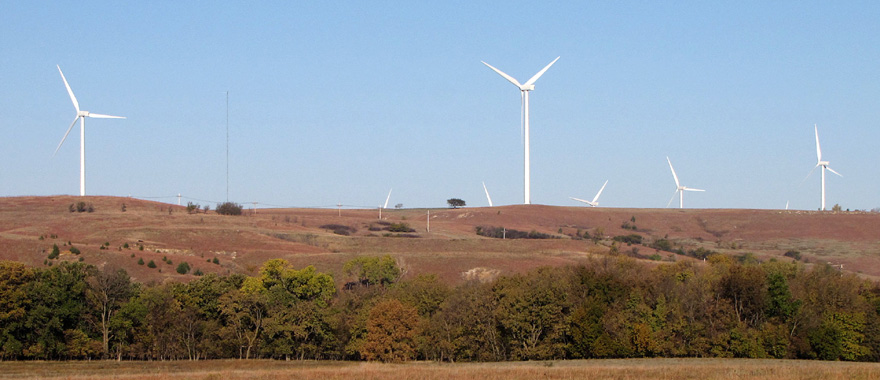
The Smoky Hills Wind Farm occupies a prominent cuesta next to lower wooded stream courses. Forest bats roost in trees along the woodland corridor during migration. Lincoln County, north-central Kansas.
![]() Back to beginning.
Back to beginning.Kansas energy resources
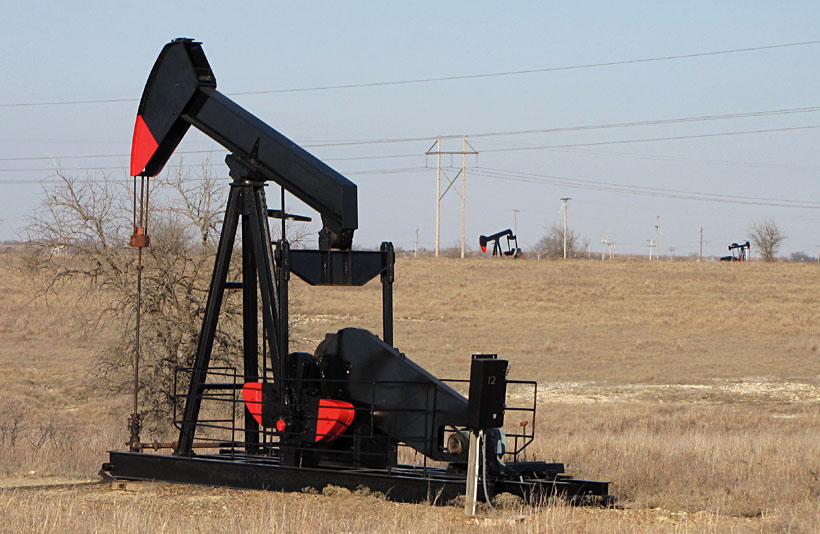
Coal, petroleum (oil), natural gas, and nuclear (uranium) were primary fuel sources for generating electricity in the 20th century. Petroleum was discovered in Kansas near Paola in 1860. Kansas became a major oil-producing state early in the 20th century; it ranked third in the nation behind California and Oklahoma in 1918. It's fair to say that oil and Kansas have grown up together (Nixon 1948). But this status has slipped over the past century, and Kansas is currently eleventh among states for oil production (EIA Oil 2022).
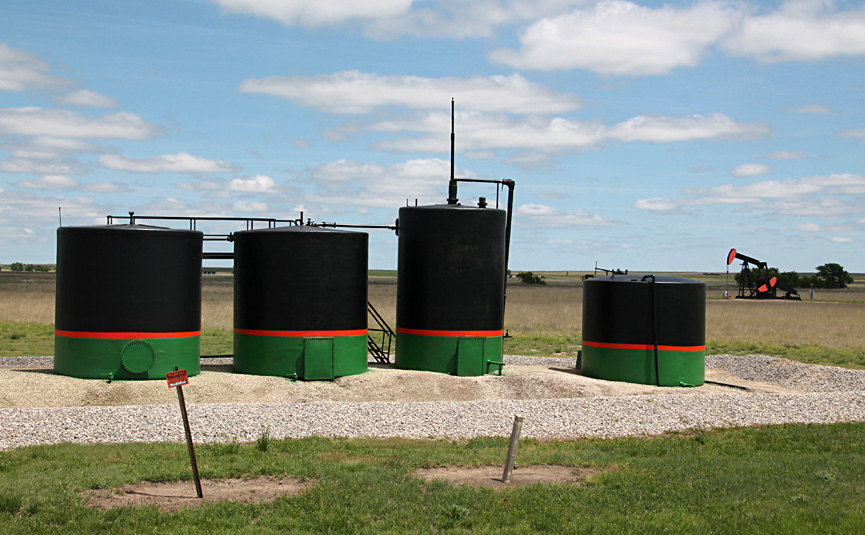
Oil storage tanks (left) in a small oil field near Ness City. Pump jack (right) in the El Dorado Oil Field, historically the largest in the state. The power lines provide electricity to run the pumps. Such features are typical in many parts of Kansas.
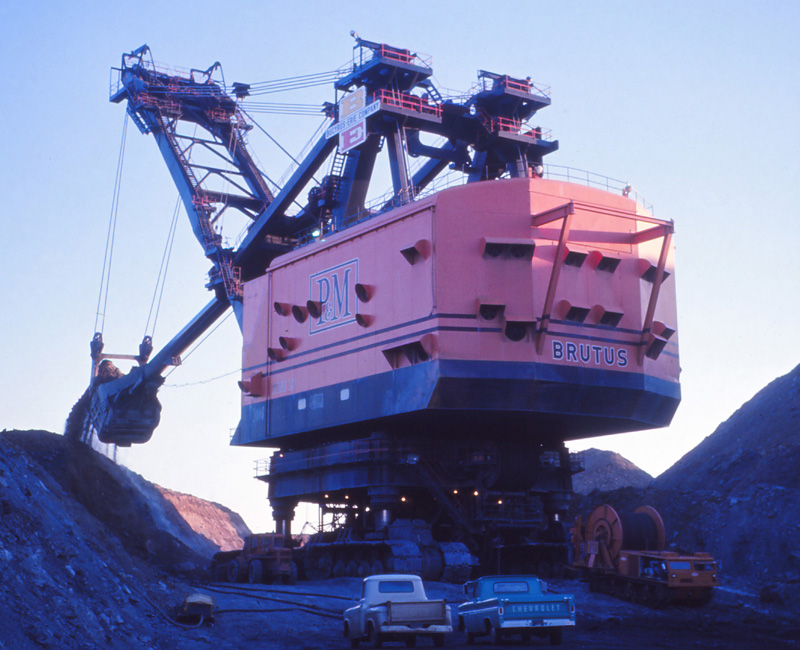
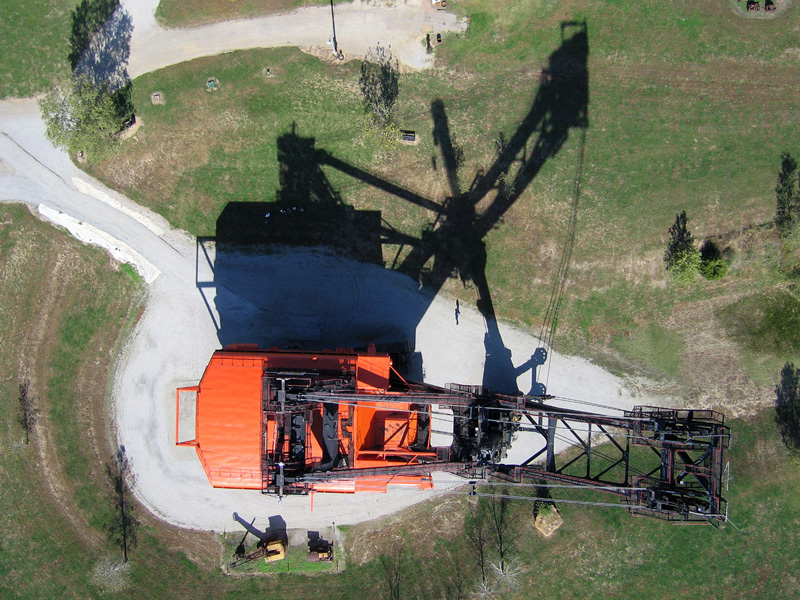
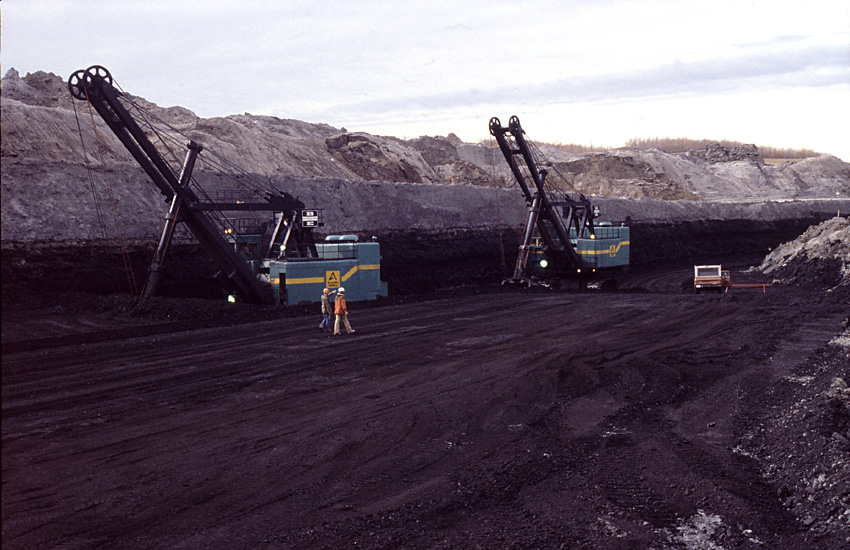
Big Brutus – One the largest electric-power shovels in the world, it stands 160 feet tall with a working weight of 5500 tons. Left: in action at a Pittsburg and Midway (P&M) coal mine in southeastern Kansas. Photograph from the Leslie and Beryl Ward collection (1966). Right: restored and on display for the public near West Mineral, Kansas. Vertical view with silhouette shadow. Note smaller power shovel and bulldozer at bottom for scale. Helium-blimp airphoto.
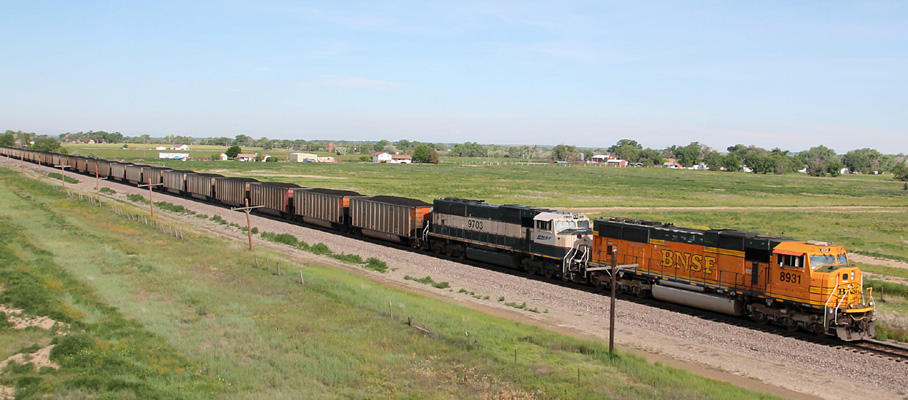
BNSF Railway coal train at Las Animas in southeastern Colorado heading east toward the coal-fired electric generating station at Holcomb, Kansas, and perhaps beyond. ![]() Back to beginning.
Back to beginning.Kansas and national energy trends
Trends in Kansas power plants and electricity generation mirror those of the United States overall. For the most recent decade, the number of coal-fired power plants has declined by more than half, and nuclear has fallen by 18%. On the other hand, natural-gas power plants have increased by 23%. Small changes are noted for petroleum and hydroelectric power plants. Renewable-energy power plants (solar and wind) have increased phenomenally, expanding more than three-fold.
* Renewable includes wind plus solar power plants.![]() U.S. electric industry power plants
U.S. electric industry power plants
by main energy resourcesYear Coal Petro-
leum Natural
gases Nuclear Hydro-
electric Renew-
able*
Rounded values. Data from EIA Table 4.1 (2023).
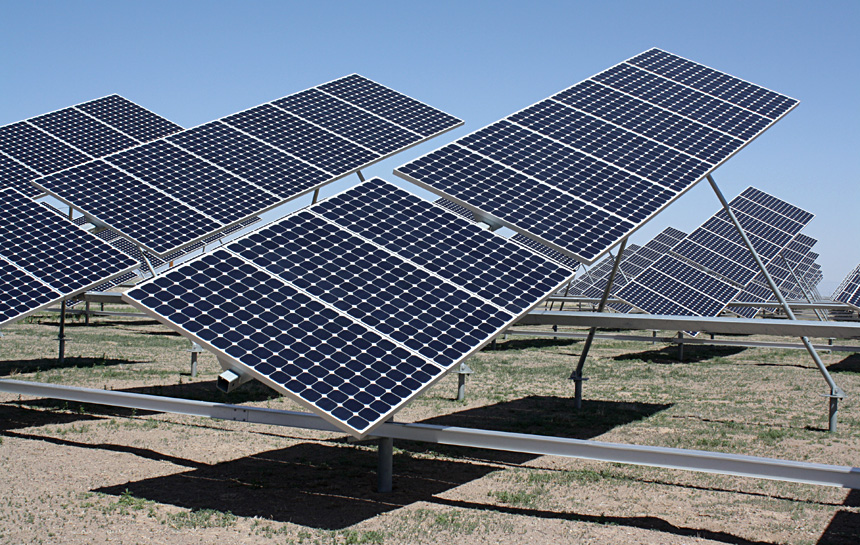
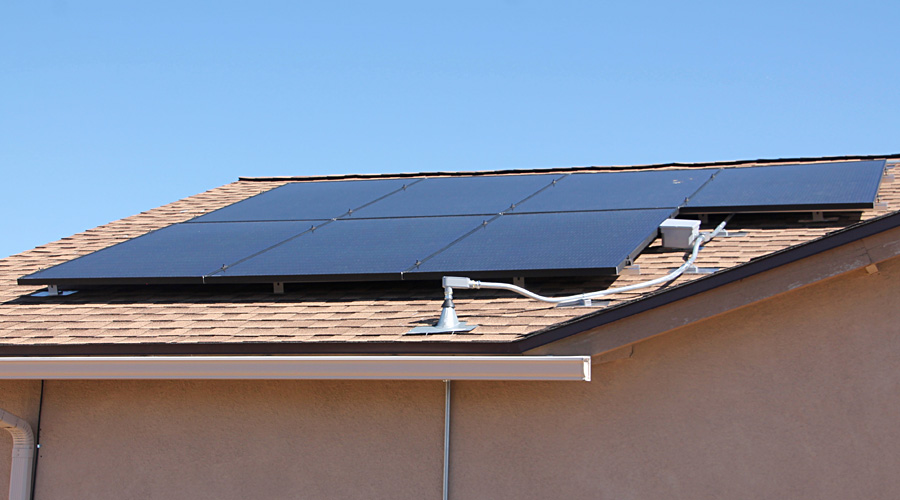
Solar-electric generation in the southwestern U.S. Solar farm (left) in the San Luis Valley, south-central Colorado. House roof-top solar panels (right), a common sight in Prescott Valley, Arizona.
Values in thousands of metric tons.![]() U.S. emissions from conventional power plants
U.S. emissions from conventional power plantsYear Carbon dioxide
(CO2) Sulfur dioxide
(SO2) Nitrogen oxides
(NOx)
Derived from EIA Table 9.1 (2024).
![]() Wind myths and disinformation.
Wind myths and disinformation. International connections
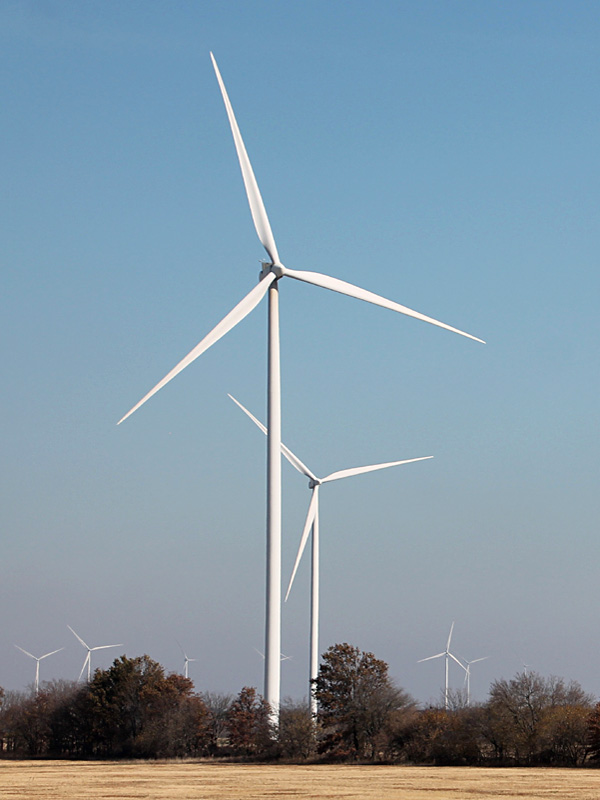
Kansas demonstrates the international character of the modern wind industry. Installed wind turbines are mainly of Danish, German, and/or Spanish origins or derivations with some components manufactured in Kansas and other nearby states (Aber and Aber 2024). Four companies dominate the wind-turbine market in Kansas—Vestas, GE Vernova, Siemens Gamesa, and Nordex. Suzlon from India is also noteworthy.
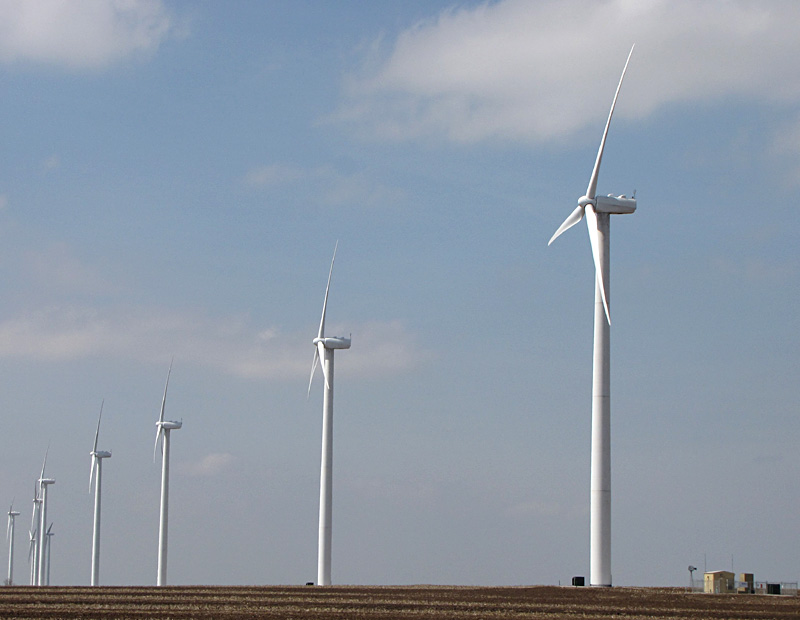
Left: early, small Vestas wind turbine in operation on the island of Fejř, southeastern Denmark (1987). Note access door and person at bottom of tower for scale. This small turbine was the ancestor of much larger modern turbines. Right: Vestas V120-2.2 MW turbines stand nearly 600 feet tall in the North Fork Ridge wind farm, southwestern Missouri.
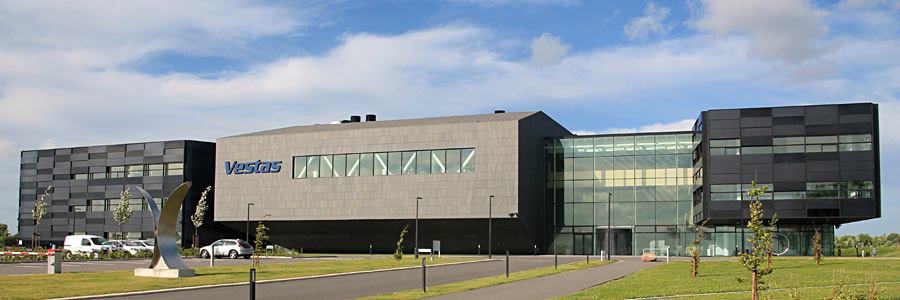
Vestas Wind Systems world headquarters was opened late in 2011 in Aarhus, Denmark.

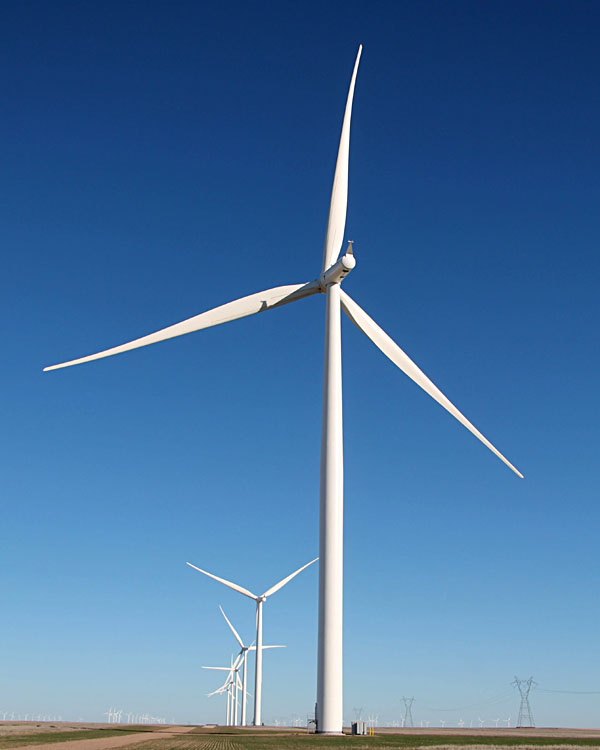
Vestas Tower manufacturing plant south of Pueblo, Colorado. V100-1.8 MW turbine on right was erected in 2010 and is designed for light-wind and/or high-altitude operation.
Siemens 2.3 MW turbines in the Cimarron II wind farm near Ingalls, southwestern Kansas. Hub height = 80 m, rotor diameter = 108 m, and total height is 134 m (440 feet). Erected in 2012 presumably with components from the factory in Hutchinson.
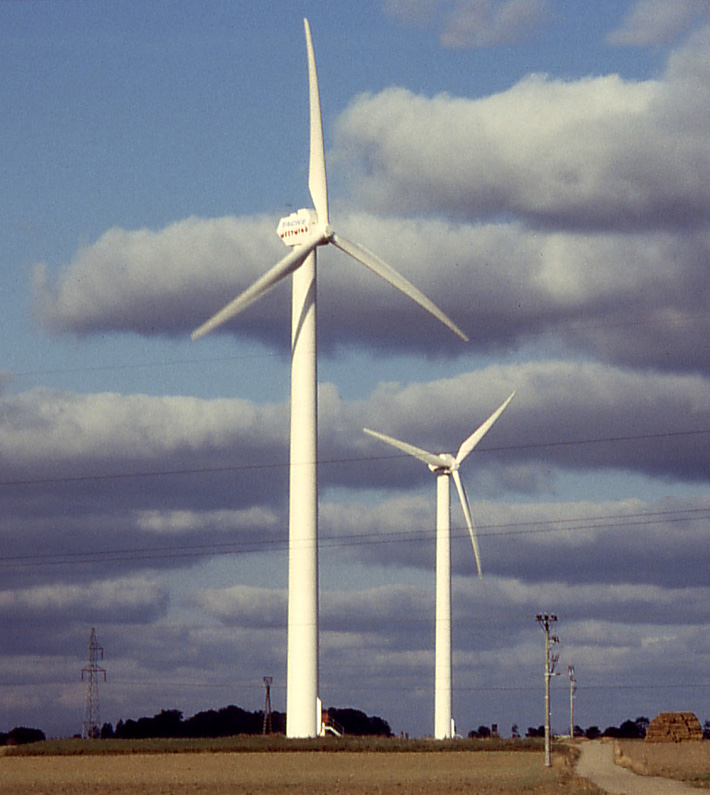
Tacke wind turbines manufactured in Germany. Left: Swarzewo, northern Poland (1998). Right: Rüdersdorf, eastern Germany (1995). Tacke is the ancestor for modern GE turbines, which are found in many Kansas wind farms, such as Elk River. 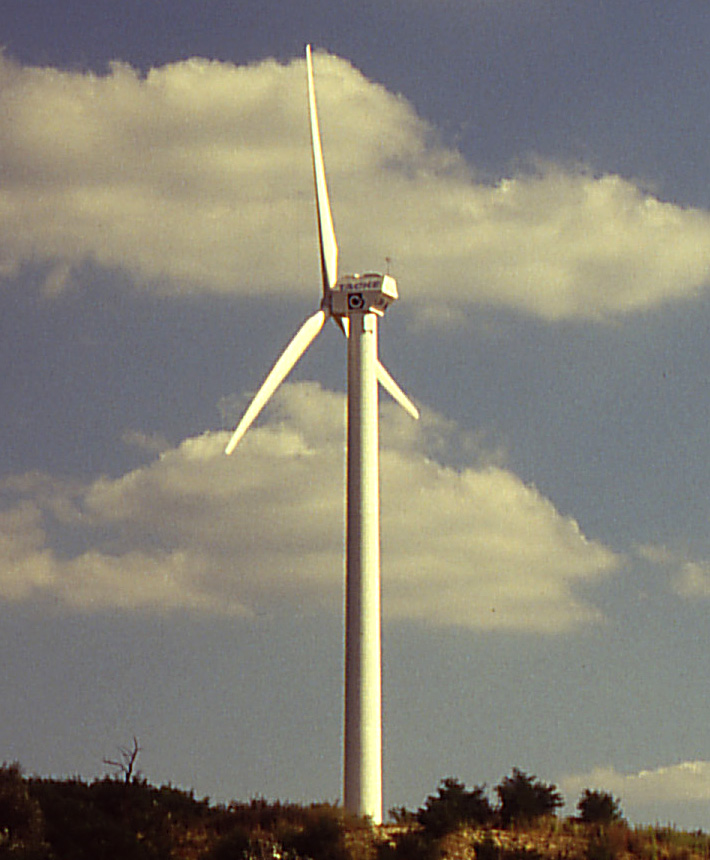
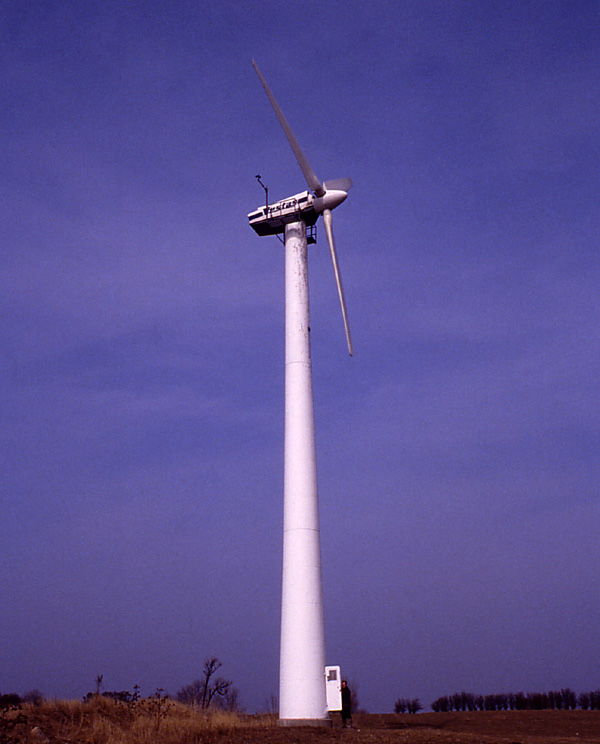
Greensburg Wind Farm on the High Plains in Kiowa County. Suzlon 1.25 MW turbines stand 72 m (236 feet) tall at hub height, and rotor diameter is 64 m (210 feet). Total height with a blade in the upright position is 104 m (341 feet).
![]() Back to beginning.
Back to beginning.Ideal energy – Radical middle
Ideal energy sources would be available, affordable, reliable, and environmentally sustainable. These are the four major tenets for energy security (Tinker 2013). Wind and solar energy are available in many regions, affordable and sustainable. Reliability is variable, but industrial-scale battery storage facilities may alleviate this problem.
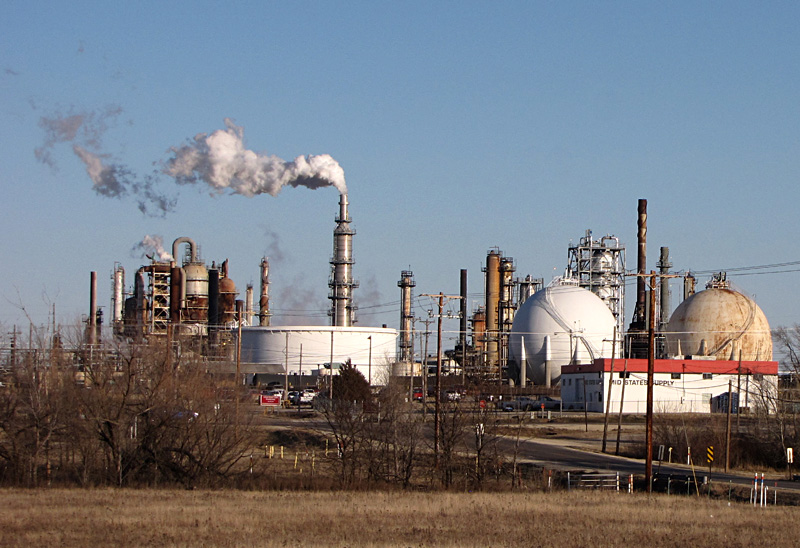
Oil refinery (right) at El Dorado, Kansas.
Siemens-Gamesa 2.3 MW turbines in the Alexander Wind Farm became operational in 2015. Total height with a blade in the upright position is 134 m (~440 feet). Rush County, Kansas in the Blue Hills on the divide between the Waltnut Creek and Pawnee River drainage basins.
Developing safe and renewable energy resources that have minimal environmental impacts is a priority for humanity in the 21st century. Kansas wind energy is part of the solution along with many other types and sources of energy. Diverse energy sources must be integrated into a production and delivery system in which the strengths of each type offset weaknesses for other types. Governments and society must look beyond narrow parochial, economic, and political self-interests toward long-term goals of human health, prosperity, and global sustainability (Aber et al. 2015).
![]() Back to beginning.
Back to beginning.References
About the authors
James S. Aber – Roe R. Cross Distinguished Professor Emeritus, Emporia State University (ESU), Kansas. Professor Aber’s interests and research experiences spread across energy resources, geology and tectonics, landscape evolution, aerial photography, and wetland environments.
The coauthors are partners for kite aerial photography which they have conducted for more than 25 years across the United States and Canada as well as northern and central Europe. ![]() Back to beginning.
Back to beginning.![]()
For further information, contact J.S. Aber: aberjim99@aim.com![]() Return to Geospectra homepage.
Return to Geospectra homepage.
Last update: June 2026.