| and eustasy James S. Aber |
| Introduction | Depression and rebound |
| Glacioeustasy | Complicated responses |
| Related sites | References |
|
| and eustasy James S. Aber |
| Introduction | Depression and rebound |
| Glacioeustasy | Complicated responses |
| Related sites | References |
In order to compensate for lithospheric depression beneath a crustal load,
the surrounding area may rise creating a forebulge. These principles
are demonstrated by the Amazon delta, where huge sediment loading has
created a central depression that is surrounded by peripheral uplifts.
In the cases of ice sheets, the amount of forebulge uplift varies from
negligible to a few 100 m at most. Te presence of a forebulge has important implications for melt-water drainage. A
drainage moat may be created between the ice margin and forebulge,
in which proglacial lakes, seas, or ice-marginal streams are confined.
As an ice sheet begins to shrink, rebound of the depressed region then
takes place during deglaciation and for several 1000 years thereafter. The rate of rebound is initially quite rapid and slows
progressively. The magnitude of postglacial rebound is nicely documented in Sweden
and eastern Canada. Five lines of evidence support the idea that recent uplift of formerly glaciated regions is the
result of isostatic rebound following deglaciation (based on Flint
1971).
The margins of many continents slope very gently into the sea forming wide,
shallow continental shelves. The Atlantic and Gulf coasts of the United
States are good examples. In such situations, shoreline positions migrated over 10s to 100s of km as sea level rose and
fell during glacial cycles. These sea-level cycles could be preserved as
intervals of marine deposits (high sea level) separated by surfaces of
erosion (low sea level). A complete sedimentary record of past sea-level
changes would ideally be developed in stable coastal areas far removed from
glaciation.
Much of the sedimentary record for Quaternary sea level is, unfortunately,
not directly accessible; it is underwater on the continental shelves. In some places older deposits have been uplifted tectonically,
but the magnitude of uplift cannot be determined from independent evidence. As a result of these problems, a global long-term
record of Quaternary sea level is not yet firmly established.
Lithospheric depression and rebound
Lithospheric depression of 100s of m takes place beneath large ice sheets
due to the static weight of the ice mass. This excess loading causes
elastic and plastic deformation in the lithosphere and underlying
asthenosphere. Crustal rock is displaced as the mantle sinks. Given ice
density of 0.9 g/cm³ and mantle rock density of about 3.3 g/cm³, the
potential depression beneath an ice sheet 1000 m thick could be as much as
275 m. This maximum depression rarely occurs, however, because of the time
lag between glacier loading and crustal response. Several 1000 years are
required for complete isostatic adjustment to take place, by which time ice
thickness has often changed.
The geological evidence for postglacial rebound is mainly based on tilted or
uplifted shoreline features. Shorelines of
ice-marginal lakes or seas are assumed to have formed horizontally. Where such
features are now tilted, this reveals crustal warping associated with rebound. Uplifted marine deposits are particularly important for
establishing the amount of postglacial rebound of coastal sites since
deglaciation. In like manner, the glacial forebulge subsides when the ice mass is reduced or removed. For example, the
Atlantic Ocean is encroaching on the Chesapeake Bay region at a rate of about
30 cm per century (Colin 1996). Similar subsidence is taking place in southern
portions of the Baltic and North Seas in Europe.
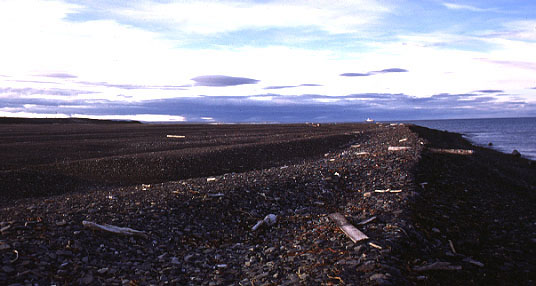
Beach ridges on coast of Novaya Zemlya, arctic Russia. Such ridges are formed by pushing
of sea ice; older ridges have been uplifted inland (to left) as a result of Holocene
glacio-isostatic rebound. Photo © by J.J. Zeeberg; used here by permission.
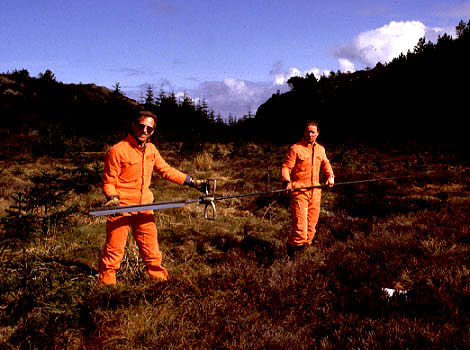
Skansen bog, island of Askøy, western Norway. Inge Aarseth (left)
and assistant display coring tool used to recover samples of sediment within
the bog. During late glacial time, this site was depressed below sea level
and the basin accumulated marine sediment. With postglacial rebound, the
site was uplifted, and lake and bog sediments have filled in.
The age of lowest non-marine sediment in the core dates the time the basin
rose above sea level. Glacioeustasy
The ice volume of current glaciers is equivalent on melting to an increase
in sea level of about 65 m (Flint 1971). During full glacial conditions of
the Pleistocene, sea level was conversely about 120 m lower than at
present. Thus the total range of eustatic sea level between glacial and
nonglacial conditions is on the order of 180-200 m. This figure does not
take into account any adjustments for crustal depression/rebound or
long-term tectonic movements of continents and ocean basins.
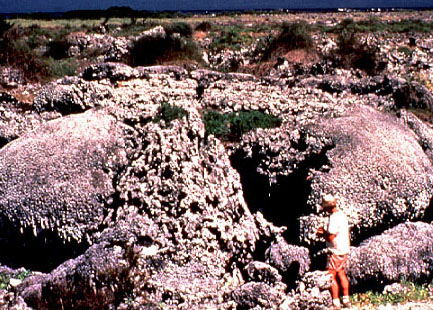
Massive coral (Pavona clavus) exposed in 1954 by tectonic uplift in
the Galapagos Islands. Coral reefs of this kind form in shallow tropical seas just
beneath low-tide level. They are a record of past sea level. Image obtained
from the World Data Center-A for Paleoclimatology, © Educational Slide Project.
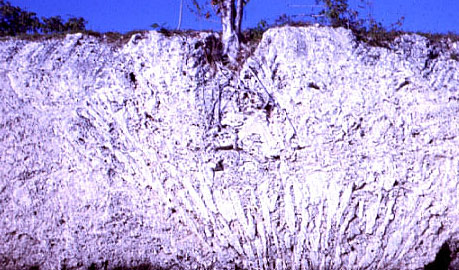
Section in Key Largo Limestone exposed in canal across Key Largo,
Florida. A large branching coral is preserved in growth postion. Key Largo is
a fossil reef that grew when sea level was 5-8 m higher than today, about 130,000
years ago. Section is about 5 m high.
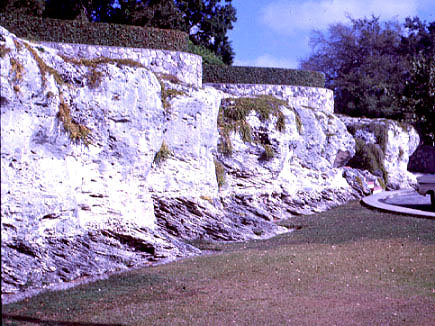
Miami Oolite, the limestone formation that underlies much of
Miami, Florida. The limestone was deposited on a shallow marine bank,
much like the modern Bahama Bank. Conspicuous cross-bedding is visible at
base of exposure. The Miami Oolite is a northern continuation of the Key
Largo Limestone trend; they were deposited simultaneouly during high sea
level about 130,000 years BP.
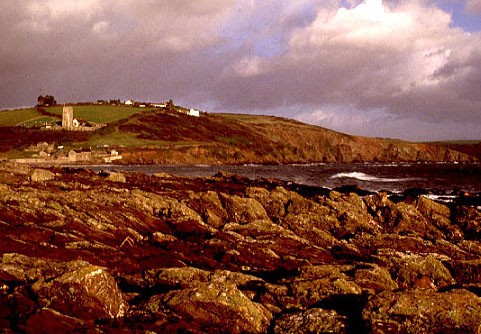
Wembury Bay, near Plymouth southwestern England. Bedrock platform in
foreground is a strandflat a few m above present sea level. It was eroded
by wave action during the Eemian high stand of sea level about 130,000 years
ago.
Another excellent record of Late Quaternary sea-level fluctuations has been documented from uplifted reefs and deltaic sediments in New Guinea. Again a high sea level, about 4 m above present, took place around 120,000 years ago. Globally high Sangamon sea level can be explained only by melting of a major ice sheet, either in West Antarctica or Greenland. Minimum sea level, nearly 130 m below present, occurred 18,000 years ago, during the maximum late Wisconsin glaciation.
Until recently, the Sangamon high stand of sea level was considered to be the highest of the Pleistocene. However, new evidence suggests that sea level was even higher during oxygen-isotope stage 11, about 420-400 thousand years ago (Hearty et al. 1999; Poore and Dowsett 2001). Sea level may have exceeded 20 m above present in the Caribbean Sea, Bahamas and Bermuda, which implies that both the Greenland and West Antarctic ice sheets were absent or greatly reduced.
Crustal rebound then took place; the coastal region was uplifted, and parts of the present shelf were eventually exposed as dry land. Soil development and forest growth took place about 10,500 years BP. Meanwhile fjords to the east were still depressed well below sea
level. Between 10,500 and 9000 years ago, most remaining glaciers on the
mainland melted and eustatic sea level rose. The results were rebound of
the fjord-head region (emergence) and drowning of the shelf area
(submergence).
Complicated responses
Changes in relative sea level can become quite complicated in coastal
regions adjacent to ice sheets. The effects of both crustal
depression/rebound and eustatic sea-level changes are involved. The
coastal area of western British Columbia shows the possibilities. Most of
the shelf of Queen Charlotte Sound was ice covered and depressed during
maximum glaciation, >15,000 years BP. When northern Vancouver Island was
deglaciated by 13,000 years BP, the shelf and coastal area was submerged
under the Pacific. Marine shorelines were locally as much as 200 m higher than today.

This region of northwestern Denmark was initially emergent land during late Pleistocene deglaciation, then was flooded by shallow sea in the Holocene, and since has emerged as a low-lying coastal environment. Hurup coast along Aalborg Bay, Kattegat Sea. Kite aerial photograph © S.W. and J.S. Aber (lower left corner of scene).
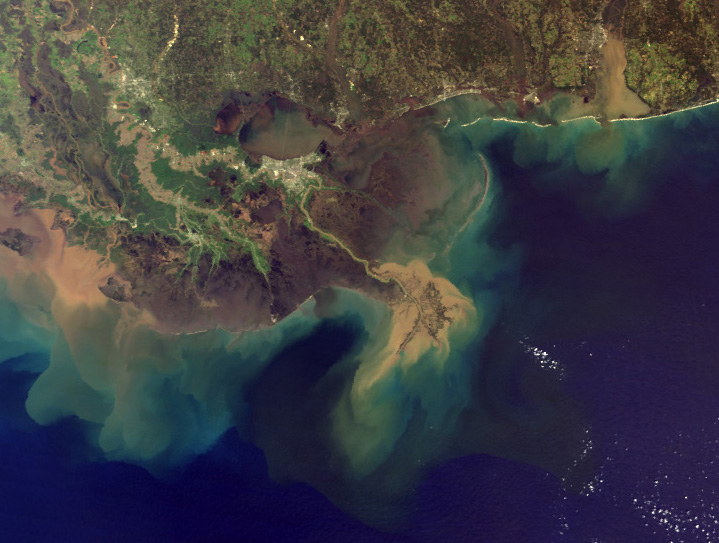
Mississippi River and Delta region, southern Louisiana and Mississippi, March 2001, prior to major hurricanes of 2005 and 2008. Note distinctive patterns of suspended sediment in coastal waters. MODIS image from the Visible Earth. 
 Related sites

 Glossary or references.
Return to Glacial geomorphology (2020).
All images and text © J.S. Aber.
 Table of Contents