Introduction
| 
|
A project for
LIBR 220 Resources and Information Systems:
Maps, GIS, and Map Librarianship
Introduction
|
|
By 1900, Los Angeles feared drought because of real population growth and the development of the San Fernando Valley. In 1905, Harry Chandler, General Harrison Gray Otis and Henry Huntington created the idea to build a 238 mile aqueduct to move water from the Owens River and bring it to the San Fernando Valley. They put a $25,000,000 bond issue on the ballot to pay for it. The Los Angeles Department of Water and Power created a fake water famine (Davis, 1998). The night before the election, people were told that water was scarce and not to water their gardens. So the bond passed. The aqueduct was built into the San Fernando Valley and the water was originally used for agricultural purposes. Eventually, Los Angeles annexed the San Fernando Valley so that they could use the water also (Davis, 1998).
By 1941, Los Angeles extended the state aqueduct into the Mono Basin. Los Angeles supported the State Water Project to bring water from northern California to southern California during the 1950s. This new extension of the California aqueduct doubled the diversion of water into southern California (Davis, 1998).
Natural fisheries and ecological systems have been decimated, especially in the San Francisco Bay Delta and Mono Lake. Realizing consequences, the California Legislature passed the Endangered Species Act in 1973, the California Environment Quality Act in 1970, and the Clean Water Act in 1972. The Metropolitan Water District began water rationing in 1989-1990, which successfully saved 1 million acre feet of water by 1993 (Davis, 1998).
A map of the Los Angeles metropolitan area is shown below.
Shown left - Permalink: Road Map of Los Angeles Metro. Map taken from
www.aaccessmaps.com/show/map/us/ca/lametro.
The latitude of the deep water ship channel of the Sacramento River is 38 degrees, 18’ 36” and the longitude is -121 degrees, 39’ 9” (Infoplease.com).
The latitude of the San Joaquin River is 38 degrees, 3’ 59” and the longitude is -121 degrees, 51’ 3” (Infoplease.com).
At the northern point of San Diego County is the beautiful Santa Margarita River. It is the last free flowing river in this county. It runs through still wild areas and through Camp Pendleton into the ocean. Its sources are two major tributaries, Temecula Creek and Murrieta Creek. The river has 4 smaller tributaries also. It drains 742 square miles within Riverside and San Diego counties (2008, Project Clean Water). Its latitude is 37 degrees, 13’ 55” and its longitude is -117 degrees, 24’ 58” (Infoplease.com)
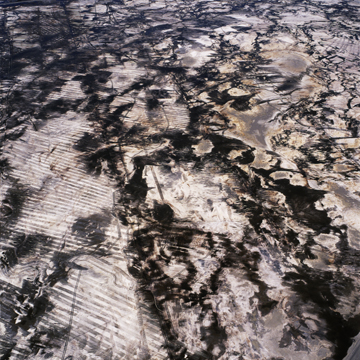
The arrow points to Black Point, which is a basaltic cinder cone volcano that erupted 12,000 years ago, and the black ash appears a reddish-purple in the image (http://landsat.gsfc.nasa.gov/images/archive/f0001.html). Paoha Island, in the middle of the lake, was created from volcanic magma, and the most recent eruptions are from 250 years ago, Negit Island or the small dark-colored island above Paoha Island (http://landsat.gsfc.nasa.gov/images/archive/f0001.html).
Visit other LIBR220 student works at www.geospectra.net/libr220/projects.htm.
Copyright 2008. Julia Weldy. All rights reserved.
BRIEF HISTORY OF WATER IN CALIFORNIA
In the 1860s, Los Angeles began to divert water supplies from perennial streams and artesian wells for irrigation. The development and mining of the region’s substantial underground water supplies began. These supplies were used up in a generation.
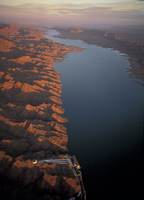
The California Water Aqueduct
in the Los Angeles area. Image
courtesy of Michael Collier,
Earth Science World Image Bank
www.earthscienceworld.org/images.
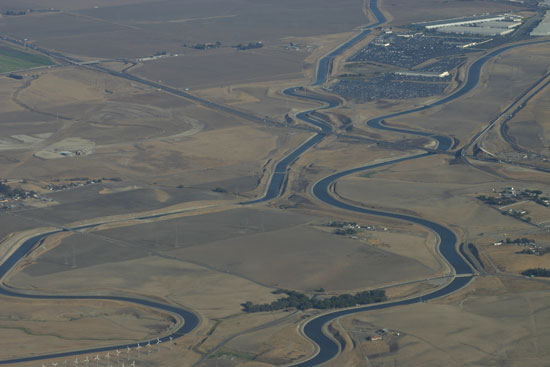
The California Aqueduct. Image by Ian Kluft.
www.britannica.com/EBchecked/topic/89567/
California-Aqueduct
In 1913, the aqueduct was finished. Later in 1915, it was extended north of Owens Valley. Also in 1915, the Boulder Dam Act was sponsored to secure water from the Colorado River. In 1928, Los Angeles created the Metropolitan Water District (MWD) of Southern California to finance the Colorado River project. The MWD extends from Ventura County to the Mexican Border (Davis, 1998).
The constant transporting of water in the aqueducts has resulted in dusty, empty Owens Lake and strange looking Mono Lake (see the Appendix for images). Shortly after Los Angeles diverted water from Mono Lake, the volume of water in the lake was cut in half and its salinity doubled. Tufas began to form out of the mineral deposits. By 1962, the lake had dropped by 25 vertical feet and shortly after that the lake islands, which protected birds and their nests, were now connected to the shoreline making the birds vulnerable to predators. By 1995, the lake level had dropped over 40 vertical feet below its prediversion level. Mono Lake is at 6380 elevation (Mono Lake Committee, 2008).
Return to the Table of Contents.
Shallow flooding helps to control
the dust from the dry lake. Image
taken from D. Maisel, Grist
Magazine,
www.grist.org/
news/maindish/2005/01/
19/maisel
STATISTICS
As of July 1, 2003, the Metropolitan Water District had imported 1 million acre feet in water from the State Water Project during the previous decade. California receives 4.4 million acre feet from the Colorado River per year. The amount sent to the Imperial Irrigation District, Coachella Valley Water District, Palo Verde Irrigation District and Yuma project is 3.85 million acre feet of water. The Metropolitan Water District receives 550,000 million acre feet of water. This keeps the Aqueduct at 80% of capacity. From the Eastern Sierra Nevada Mountains, California receives 300,000—400,000 acre feet per year of water; less water in the future will be available because of the need to restore Owens Valley and Mono Lake (Davis, 1998).
Return to the Table of Contents.
DEMOGRAPHICS OF SOUTHERN CALIFORNIA
Southern California consists of the following counties: Imperial, Los Angeles, Orange, Riverside, San Bernardino, San Diego and Ventura. According to the 2000 census, approximately 19.6 million people live in those counties. Agriculture is still significant but land is increasingly changing to urban. As a result, water supplies need to begin coming from groundwater, recycling, and conservation. Desalination of ocean water and capturing rainfall are other methods that need to be studied. Water agencies need to find new and improved ways to manage their watershed projects.
MAJOR RIVERS OF CALIFORNIA
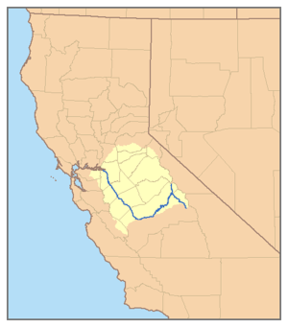
California’s longest river is the Sacramento River which is 380 miles long. Its source is near Mt. Shasta and it flows southwest to Suisan Bay, an arm of San Francisco Bay. It forms a large delta with the San Joaquin River. The Central Valley Project diverts its water to use in irrigation for the San Joaquin Valley. Shasta Dam and Keswick Dam provide electricity. Ships can travel on the Sacramento River from San Francisco. The channel is deep and whales have been photographed in the Sacramento River.

Map taken from
www.en.wikipedia.
org/wiki/Sacramento_River
Taken from http://en.wikipedia.org/wiki/San_Joaquin_River
The San Joaquin River is the second longest river in California. It is 330 miles long. It originates in the Sierra Nevada Mountains and drains from the southern border of Yosemite, and south to Kings Canyon National Park. The tributaries of this river include the Stanislaus River, Tuolumne River, Merced River, Calaveras River and Mokelumne River (http://www.sanjoaquinbasin.com/). The San Joaquin River joins the Sacramento River near the town of Antioch.
COLORADO RIVER WATERSHED
The source of the Colorado River is Grand Lake, Colorado in Rocky Mountain National Park. It is 1450 miles long and runs well beyond the Colorado border. It is joined by the Green River in Utah and runs along the border of California and Arizona. Part of the river runs into Mexico, and this country entered into a 1944 treaty for receiving 1.5 million acre feet of water. The California Canal of the Colorado River Aqueduct is latitude 33 degrees, 41’ 10” and the longitude is -115 degrees, 56’ 3” (Infoplease.com). An image of the extensive Colorado River watershed is shown right.
RIVERS IN SAN DIEGO COUNTY
Numerous rivers run through San Diego County from the local mountains all the way to the ocean. Mountain ranges in this county are known as Palomar Mountain and the Laguna. Because this county is actually a desert, they are usually dry. When it rains, San Diego may experience flash floods. San Diego River goes through Mission Valley in San Diego and the river is totally paved and channeled as a canal. Strange as this may sound, the river goes through the parking lots of the Fashion Valley and Mission Valley malls and along an east-west freeway. Additional rivers in the county, San Dieguito River and San Luis Rey River, travel many miles to the ocean. Some highways still curve around the rivers, following the old Indian trails. The rivers empty into lagoons before they reach the ocean.
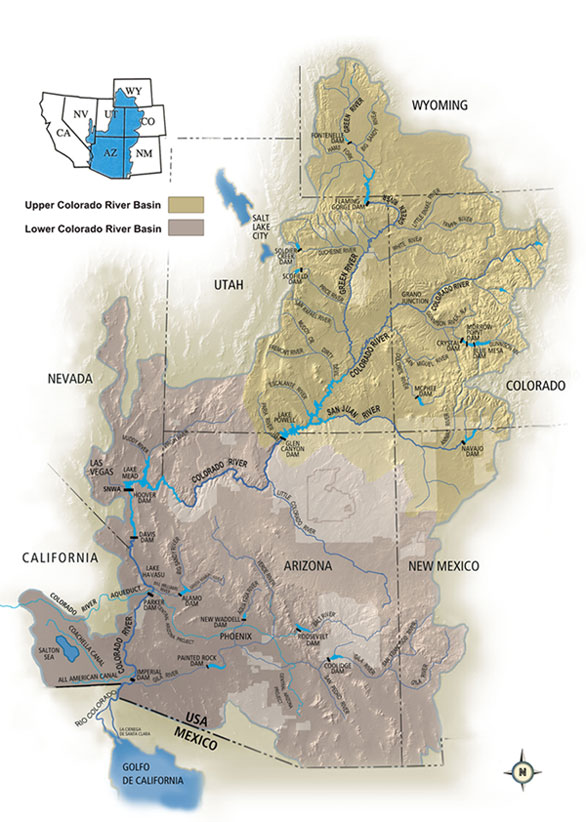
Image from Glen Canyon Dam Adaptive
Management Program, www.gcdamp.gov/aboutamp/crb.html
Return to the Table of Contents.
WATER DISTRICTS IN CALIFORNIA
Numerous water districts exist in California and local water boards are very important. Recently the fire in Yorba Linda was not contained because its water board had not provided working fire hydrants and adequate water sources to its newest neighborhoods on a hill. This allegation has resulted in a major law suit and may be in the courts for some time. This information was reported on a Los Angeles news radio 640 AM and the local and regional newspapers. In San Diego County, 24 different agencies exist. They are overseen by the San Diego County Water Authority. Currently, another water issue concerns the Santa Margarita River and will likely be controversial. Some people want to dam it, but local conservancy groups will fight that because it is the last free river in the county and a dam would likely have a negative impact on the flora and fauna. Water district maps and other images are shown in the appendix section.
CONCLUSION
Water will continue to always be a major issue as it has been throughout California’s history. People need to be educated about water ecology and what it takes to get it to our faucets and bottles. Looking at pictures and maps of the great rivers and of what happens to water sources when they are overused is important for the public. Librarians could provide maps and literature about this subject for their patrons to educate them. Special speakers from one’s local water agencies could also be helpful.
Return to the table of contents.
APPENDIX
These are some interesting pictures at sunset of Mono Lake and the tufa formations that form because of the high evaporation and the Metropolitan Water District emptying the lake. These photographs were taken by Jeffrey Munro, www.jeffreymunro.com/amazingpics/images.
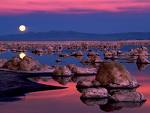
jeffreymunro.com/amazingpics/
index_old.php?showimage=549
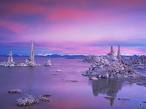
jeffreymunro.com/amazingpics/
index_old.php?showimage=550
This NASA image of Mono Lake, California is a false-color composite made from the mid-infrared, near-infrared, and green spectral channels of the Landsat 7 ETM+ sensor (http://landsat.gsfc.nasa.gov/images/archive/f0001.html). Waters appears a bluish-black and vegetation appears bright green. The lake has no outlet to the ocean and water that enters can only exit by evaporation. Thus, the salnity of the lake is 95% or three times the salinity of the ocean (http://landsat.gsfc.nasa.gov/images/archive/f0001.html).
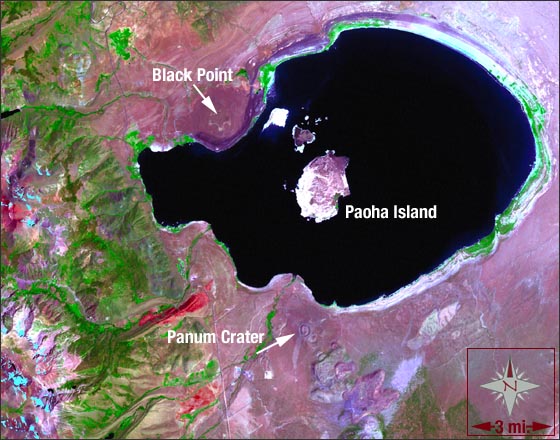
Mono Lake satellite image.
landsat.gsfc.nasa.gov/graphics/img/f0001.jpg.
The image is from Dec. 18, 1999.
WATERSHEDS DISTRICTS OF SOUTHERN CALIFORNIA
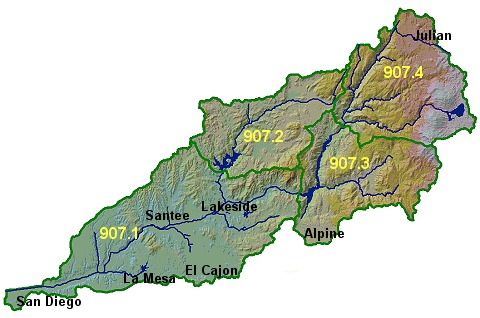
San Diego River Watershed,
http://www.projectcleanwater.org/html/ws_san_diego_river.html.
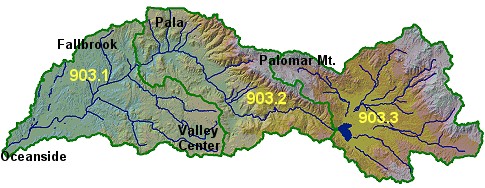
San Luis Rey River Watershed
www.projectcleanwater.org/html/ws_san_luis_rey.html

Santa Margarita Watershed.
This is my favorite area because it is where my beautiful hometown is located.
http://www.projectcleanwater.org/html/ws_santa_margarita.html
REFERENCES and RESOURCES